Contributed by: Nick Defenthaler, CFP®, RICP®

Summer has officially arrived, and with the longer days, warmer weather, and vacation plans, many Michigan families are looking forward to making the most of the season ahead. Whether you're planning trips Up North, spending weekends at the lake, or simply enjoying time with family and friends, summer is a great time to slow down and focus on what matters most.
While school may be out and education isn't top of mind for many families right now, summer can actually be an excellent time to revisit long-term goals—especially when it comes to planning for future college expenses. With fewer school-related commitments and a fresh season ahead, now is a good opportunity to review your education savings strategy and make sure you're on track.
Below is a brief refresher of the 529 plan, a popular type of account you can save into for future college expenses. Here are some caveats:
Advantages:
State tax deduction on contributions up to certain annual limits (varies by state)
Tax-deferred growth
No taxation upon withdrawal if funds are used for qualified educational expenses (such as tuition, books, room and board, computers, etc.)
Parents have control over the account and can transfer the account to another child
Not subject to kiddie tax rules, unlike UGMA accounts (Uniform Gift of Minors Act) and UTMA accounts (Uniform Transfer to Minors Act)
Disadvantages:
No guaranteed rate of return – subject to market risk
Certain taxes and penalties will apply if funds are withdrawn for non-qualified expenses
Items to be aware of:
Keep records of how money was spent that was withdrawn from the 529 account in case of an audit
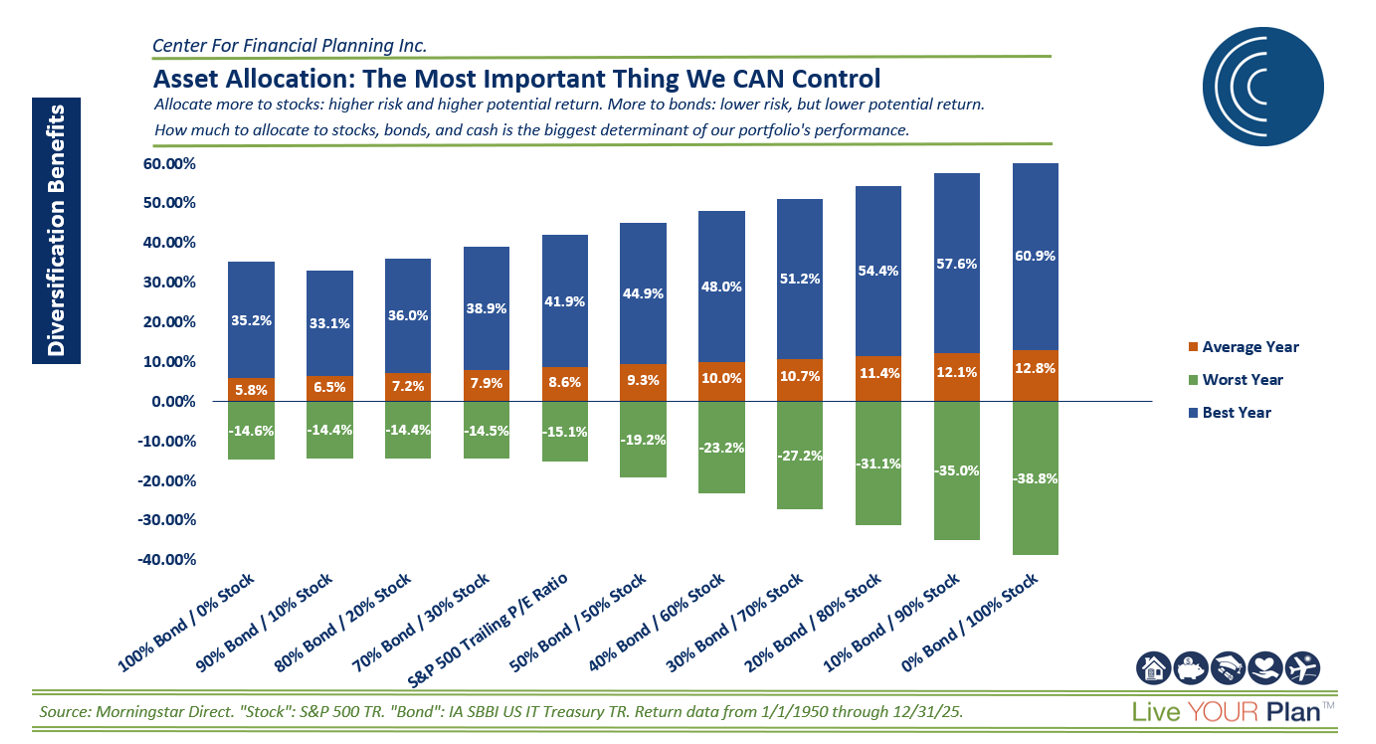
Review the asset allocation/risk profile of the account on an annual basis – typically, the closer the child is to entering college, the more conservative the account should become
Just like saving for retirement, the sooner you can start saving for college the better. With that being said, if your children are only a few years out from college and your savings isn’t where you’d like it to be, there is still hope. Chances are you still have options and this is where good financial planning can come into play. There are also nuances with financial aid and completing the FAFSA that you want to be aware of. If we could provide guidance in this area, don’t hesitate to reach out, we would be happy to help!
For additional insights on education planning, be sure to check out our latest webinar, The Hidden Benefits of College Savings Plans.
Nick Defenthaler, CFP®, RICP®, is a Partner and CERTIFIED FINANCIAL PLANNER™ professional at Center for Financial Planning, Inc.® Nick specializes in tax-efficient retirement income and distribution planning for clients and serves as a trusted source for local and national media publications, including WXYZ, PBS, CNBC, MSN Money, Financial Planning Magazine and OnWallStreet.com.
The foregoing information has been obtained from sources considered to be reliable, but we do not guarantee that it is accurate or complete, it is not a statement of all available data necessary for making an investment decision, and it does not constitute a recommendation. Any opinions are those of Nick Defenthaler and are not necessarily those of Raymond James. As with other investments, there are generally fees and expenses associated with participation in a 529 plan. There is also a risk that these plans may lose money or not perform well enough to cover college costs as anticipated. Most states offer their own 529 programs, which may provide advantages and benefits exclusively for their residents. The tax implications can vary significantly from state to state. Asset allocation does not ensure a profit or guarantee against loss.