
 Wow, what a year for the markets in 2013! Despite a rough end to 2012, uncertainty regarding the affordable care act and fiscal cliff, political tension in Syria and a government shutdown, U.S. stock markets surged and reached record highs. When all was said and done, the Dow was up 26.5% and the S&P 500 rose by 29.6% for the year. When you see numbers like that, you may think, “My accounts did very well this year, but they aren’t up close to 30%!” That is a perfectly natural reaction. One reason you most likely did not see these types of returns is due to diversified asset allocation.
Building a diversified portfolio using asset allocation can be tricky. Let’s use a 60% stock, 40% bond portfolio as our example. Stocks are typically more risky and bonds tend to be more conservative and they often work inversely with one another. When one is doing well, the other may be lagging. This can help to even out returns and reduce the large swings in account values. Within those two categories, one may see several different classes that comprise the 60% stock and 40% bond allocation. The stock side may include domestic large and small cap equities, international, emerging markets, energy, real estate, etc. The bond side may include options such as short-term corporate debt, international, emerging markets or government bonds, etc. The key is to build a portfolio that fits an investor’s individual long-term goals and needs so that the proper amount of stock and bonds can be utilized to help achieve those goals over different market conditions.
In the chart below, we compare a $500,000 portfolio that is invested in 60% stock, 40% bonds and one that is 100% invested in stocks, as represented by the S&P 500 from 2000 – 2013. The results are pretty staggering. As you can see, in years the market did well, the diversified 60/40 portfolio lagged the performance of the S&P 500. This is something we would expect because of the portfolio’s exposure to bonds. However, in years where the S&P 500 did very poorly, such as 2001 and 2008, the 60/40 portfolio was down significantly less compared to its counterpart. The downside hedging is what I want to focus on. When one loses 40% of their account values like many investors experienced in 2008, he or she would need to realize a 67% gain to get back to even. It can take a very long time to recover such substantial losses like we saw in 2008. Diversification is the main reason why the 60/40 portfolio is worth $272,000 more than the all-stock portfolio during the same time period.

Indices Used: S&P 500, MSCI EAFE, & Barclays Cap Agg

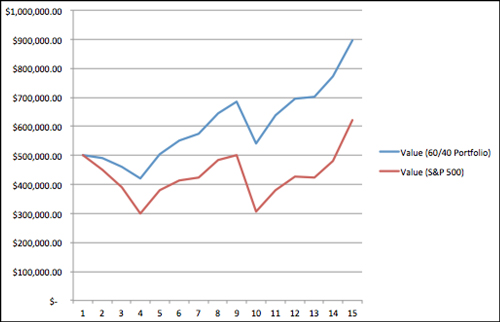
Sources: Barclays Cap Agg Indices, Standard & Poor’s Indices, MSCI EAFE, and Bloomberg Markets
The S&P 500 is an unmanaged index of 500 widely held stocks that is generally considered representative of the U.S. stock market. Individuals cannot invest directly in any index, and index performance does not include transaction costs or other fees, which will affect actual investment performance. Individual investor’s results will vary. Past performance does not guarantee future results.
Let’s be honest – we all wish we could have the best of both worlds. Who wouldn’t want to eat poorly, not exercise and still have that six pack? The same can go for investing. Many investors want to achieve 30% returns like we saw in 2013, but they don’t want to lose money in an environment where stocks decline 30%. This is why The Center builds diversified portfolios for clients using asset allocation. Asset allocation is not necessarily a “flashy” way of investing, nor does it get a dedicated nightly television show like Jim Cramer. However, the lack of media attention has no bearing on its potential effectiveness for long-term, disciplined investing. We understand and can empathize with clients when they are concerned that their accounts may not be participating in a market run up as much as they are seeing in the headlines. However, it is our job as your financial planning team to discuss the reasoning for this discrepancy and to help keep you focused on the long-term plan, which is what ultimately leads to investor confidence.
Nick Defenthaler, CFP® is a Support Associate at Center for Financial Planning, Inc. Nick currently assists Center planners and clients, and is a contributor to Money Centered and Center Connections.
Any information is not a complete summary or statement of all available data necessary for making an investment decision and does not constitute a recommendation. Prior to making an investment decision, please consult with your financial advisor about your individual situation. Any opinions are those of Center for Financial Planning, Inc. and not necessarily those of Raymond James. Diversification and asset allocation do not ensure a profit or protect against a loss. Investing involves risk and you may incur a profit or loss regardless of strategy selected. C14-003064