Investment Planning

Logic & Taxes Don’t Mix

A question I get a lot at income tax time is, “Can I deduct investment management fees?” While this should be a straight forward answer…we are talking about the tax code where nothing is simple.  As a law professor of mine once said, never put logic and income taxes in the same sentence.  Your tax preparer is the best person to consult with on this issue – but in the meantime, here are some guidelines:

The first place to start when trying to determine if an investment management fee is deductible or not is to determine the type of account (Taxable, Traditional IRA, Roth IRA, 401k, etc.).

Investment management fees paid in taxable accounts (such as single, joint or living trust accounts) are a tax deductible expense and reported as a miscellaneous itemized deduction on Schedule A of Form 1040.  That’s the easy part – but not the whole story. There is more to the story because not everyone can actually benefit from miscellaneous itemized deductions.  In order to benefit from your miscellaneous itemized deductions, in aggregate they must exceed 2% of your Adjusted Gross Income. As an example, if you have Adjusted Gross Income of $75,000, then the first $1,500 of miscellaneous itemized deductions are not deductible – only the balance can be deducted.  To further confuse the issue, if you are subject to the Alternative Minimum Tax some or all of these deductions could be disallowed as a tax preference.

For accounts such as Traditional IRA’s, ROTH IRA’s, and 401k’s, my interpretation of the tax code is that investment management fees paid by assets in the account are not deductible nor are they considered taxable income. In summary: not deductible (but you don’t pay income on the fee either). That said, some will argue that the fee is deductible, just as it is for taxable accounts discussed above. Lastly, some tax professionals will suggest that the fee is deductible if paid with money outside of the IRA. For example, some tax professionals will suggest that fees attributed to IRA type funds be paid via a separate check making them deductible.

As you can see, there are some gray areas on this topic.  What can you do?

  • Be sure to share the fact that you paid investment management fees with your tax preparer
  • Break the fees out by account type (taxable versus other types)

The information has been obtained from sources considered to be reliable, but we do not guarantee that the foregoing material is accurate or complete.  Any opinions are those of Center for Financial Planning, Inc., and not necessarily those of RJFS or Raymond James.  Please note, changes in tax laws or regulations may occur at any time and could substantially impact your situation.  While we are familiar with the tax provisions of the issues presented herein, as Financial Advisors of RJFS we are not qualified to render advice on tax or legal matters.

Marilyn’s Book Review - The Little Book of Economics

As the story goes, ask two economists or five what the future will bring and what is going on and you get as many answers.  Finally, there is a clear, well-written book that is concise and up-to-date giving us some insight as to why this situation exists.  More importantly, the book explains the basics of economics in a readable manner, discusses the booms and busts of the past 20 years and, in particular, the most recent downturn.  The author discusses how economic concepts and institutions affect our lives.  There are few charts and graphs, just logically written explanations infused with story examples and some humor. So, what is the book?

The Little Book of Economics:  How the Economy Works in the Real World written by Greg Ip, an educated economist and journalist.  He is the U.S. editor for The Economists and has written for the Wall Street Journal and the New York Times. This 250-page book is available at bookstores, through Amazon and can be downloaded to your Kindle or iPad.

As one reviewer said, “Finally, an economics book that is neither dull nor inscrutable and won’t put you to sleep. This little gem can turn all of us into sophisticated and educated citizens”.  I agree. 


Opinions are those of the author and not necessarily those of Raymond James.  This is not meant as an endorsement of the listed material by Raymond James.

The Gambler

While I’m not a big country music fan, one of the few country songs I can sing along to is “The Gambler” by Kenny Rogers.  While Kenny certainly knew how to make money, he also had a pretty good idea of how to keep it:  “You gotta know when to hold ‘em, know when to fold ‘em, know when to walk away and know when to run.”  There’s a valuable lesson for investors in those lyrics. 

When investing most people (and professionals too), spend a lot of time deciding which investments to buy and little time understanding when to sell.  Having a security selection process and understanding what you own and why you own it is important to the investment process, as you can read about here, but it may be even more important to successful investing to have a proper sell discipline.  

Part of your process, even before buying a security, should be to outline reasons you would hold the investment even, perhaps, through periods of underperformance and also to establish factors that would cause you to sell it in the future.  At The Center for Financial Planning, Inc. some of our potential sell reasons include: 

  • Key personnel departure
  • Attainment of your price target
  • Increased correlation to other investments; and so on.

Having these points in mind makes it easier and much less emotional when thinking about selling a position.  

While it is usually best to buy and hold over longer periods of time, it is a good idea to play devil’s advocate with your portfolio.  Have you heard of the endowment effect?  Simply put the endowment effect states that once you own something you start to place a higher value on it than others would.  A way to potentially mitigate the endowment effect is to ask yourself, “If I were to build a portfolio today would this security be part of it?”  If the answer is “no” then it may be time to sell the investment and purchase something with greater growth potential from this point forward. 

Knowing when to hold ‘em and fold ‘em doesn’t come easily. But with some thought, you can successfully time when you buy and when you sell, because you never want to have to walk away … or worse yet … have to run!

James Montier.  Little Book of Behavioral Investing.  2010


The information contained in this report does not purport to be a complete description of the developments referred to in this material.  Any information is not a complete summary or statement of all available data necessary for making an investment decision and does not constitute a recommendation.  Every investor’s situation is unique and you should consider your investment goals, risk tolerance and time horizon before making any investment.  Investing involves risk and you may incur a profit or loss regardless or strategy selected.  Consult a Financial Advisor before implementing any investment strategy.  Links are being provided for information purposes only.  Raymond James is not affiliated with and does not endorse, authorize or sponsor any of the listed websites or their respective sponsors.  Raymond James is not responsible for the content of any website or the collection or use of information regarding any website’s users and/or members.

Three Legged Stool Strategy

Generating income in retirement is one of the most common financial goals for retirees and soon to be retirees.  The good news is that there are a variety of ways to “recreate your paycheck”. Retirement income might be visualized using a “Three Legged Stool”.  The first two sources or legs of retirement income are generally social security and pensions (although fewer and fewer retirees are covered by a pension these days). The third leg for most retirees will come from personal investments (there is a potential fourth leg – part time work – but that’s for another day).  It is this leg of the stool, the investment leg, that requires preparation, planning and analysis. The most effective plan for you depends on your individual circumstances, but here are some common methods for your consideration:  

  1. Dividends and Interest
  2. 3 – 5 Year Income Cushion or Bucket
  3. The Annuity Cushion
  4. Systematic Withdrawal or Total Return Approach 

Dividends & Interest:

Usually a balanced portfolio is constructed so your investment income – dividends and interest – is sufficient to meet your living expenses.  Principal is used only for major discretionary capital purchases.  This method is used only when there is sufficient investment capital available to meet your income need after social security and pension, if any. 

3-5   Year Income Cushion or Bucket Approach:

This method might be appropriate when your investment portfolio is not large enough to generate sufficient dividends and interest. Preferably 5 (but no less than 3) years of your income shortfall is held in lower risk fixed income investments and are available as needed. The balance of the portfolio is usually invested in a balanced portfolio. The Income Cushion or Bucket is replenished periodically.  For example, if the stock market is up, liquidate sufficient stock to maintain the 3-5 year cushion. If stock market is down, draw on the fixed income cushion while you anticipate the market to recover.  If fixed income is exhausted, review your income requirements, which may lead to at least a temporary reduction in income. 

The Annuity Cushion

This method is very similar to the 3-5 year income cushion. A portion of the fixed income portfolio is placed into a fixed-period immediate annuity with at least a 5-year income stream.  This method might work well when a bridge is needed to a future income stream such as social security or pension. 

Systematic Withdrawal or Total Return Approach

Consider this method again if your portfolio does not generate sufficient interest and dividends to meet your income shortfall. Generally speaking, a balanced or equity-tilted portfolio in which the income shortfall (after interest income) is met at least partially from equity withdrawals.  Lastly, set a reasonably conservative systematic withdrawal rate, which studies suggest near 4% of the initial portfolio value adjusted annually for inflation. 

After helping retirees for the last 27 years create workable retirement income, we have found that many times one of the above methods (and even a combination) works in re-creating your paycheck in retirement.  The key is to provide a strong foundation – or in this case – a sturdy stool. 

Any information is not a complete summary or statement of all available data necessary for making an investment decision and does not constitute a recommendation.  Any opinions are those of Center for Financial Planning, Inc., and not necessarily those of RJFS or Raymond James. Investments mentioned may not be suitable for all investors.  Dividends are not guaranteed and must be authorized by the company’s board of directors.  There is an inverse relationship between interest rate movements and fixed income prices.  Generally, when interest rates rise, fixed income prices fall and when interest rates fall, fixed income prices generally rise.  Investing involves risk and you may incur a profit or loss regardless of strategy selected.

Salad Surprise

A friend of mine, let’s call him Tom, is constantly put on a diet by his wife.  One of the ways Tom appeases her is by ordering taco salads in a restaurant instead of a traditional entree.  She assumes he’s being healthy, but little does she know, some of the worst taco salads can pack in as many as 1,700 calories and over 100 grams of fat! Someone needs to do her homework.

As important as it is to the success of dieting to understand what you are eating, it is equally important to understand what you are buying when making an investment.  The due diligence process is initiated with the establishment of current tactical allocation, which you can read more about here.  With the asset classes identified, it is time to start doing your homework by researching to identify the appropriate securities to fill each asset bucket.

  • Define and Research:  Review asset category and characteristics of the category.  Consider opportunities and risks.
  • Know what you own:  Look at a prospectus or Statement filed with the SEC to make sure you are buying what you think you are buying (is it a healthy salad or, in Tom’s case, the equivalent of 37 strips of bacon?). 
  • Quantitative Review: Review of performance and risk characteristics of investment options within the category.  Criteria may include:
    • Look at performance standouts over different time periods – 1, 3, 5, 10 years.
    • Review performance in difficult time periods (bear markets or periods of performance difficulty for the asset category). 
    • Check out standard deviation, or risk, relative to similar investments.
  • Establish reasons for conviction:  This can prevent you from falling into a common investor behavior of selling the investment when it is out of favor (which is usually the best time to purchase it).

Do your investment “waistline” a favor and do your homework. Don’t be fooled by taco salads, make sure you are really getting what you want when it comes to investing by having a defined buying process or talking to your financial planner today about establishing one that is appropriate for you!

The information contained in this report does not purport to be a complete description of the securities, markets, or developments referred to in this material.  Past performance may not be indicative of future results.

Talkin’ Tuna . . . A look at historical stock v. bond valuations

If the price of tuna doubled over a three-year period, you would expect consumption to plummet.  Even people who loved the “Chicken of the Sea” would look elsewhere for their protein.  But, come a sudden 30% to 50% markdown, buyers would flock back in to the store shelves.  That’s because, in every aspect of our economic life, our unconscious mantra is -- High Prices = bad.  Low prices = good.   And 2 for 1 is even better!

But when people walk through the magical door marked “investments”, something profoundly weird happens.  Suddenly (though still unconsciously), it is high prices = good.  Low prices = bad. 

So, I have searched through history for a measurement tool to provide more “meat” to the conversation than price alone can provide.  Today people are very uncertain.  Unemployment still looms over 9 percent for the 3rd year, we have weak consumer confidence and many economists and investors predicted a double dip recession over the last year.

While these factors are certainly concerning, they are secondary or tertiary indicators. They influence the future, but do not predict it with much certainty. In the end, the stock market has, and always will be, about price compared to value.

American companies have finished 2011 with historically strong profits thanks to effective management, cost cutting and postponing some projects.  Add to that strong balance sheets and some strategists I listen to regularly (we’re talking people who have been at it for 40 years) have said that American companies are in the strongest position ever in their careers.

The recent fear last fall about the future of the US economy has caused a significant dislocation between the government bond market and S&P 500 earnings. US government debt has been bid up to record-low yields while S&P 500 earnings continue to increase. To illustrate the dislocation, we prepared the following charts.  Chart 1 gives a very long-term historical perspective and chart 2 zooms into modern day.

CHART #1 Source: Forbes.com

The earnings yield of the S&P 500 shows the percentage earned by the company for each dollar invested in the stock.

Money managers often compare the earnings yield of a broad market index (such as the S&P 500) to prevailing interest rates, such as the current 10-year Treasury yield. If the earnings yield is less than the rate of the 10-year Treasury yield, stocks as a whole may be considered overvalued. If the earnings yield is higher, stocks may be considered undervalued relative to bonds.

Economic theory suggests that investors in equities should demand an extra risk premium of several percentage points above prevailing lower risk rates (such as T-bills) in their earnings yield to compensate them for the higher risk of owning stocks over bonds and other asset classes.
 

And investors typically purchase Treasury securities when they are worried about markets and the economy, which moves the yield on the note down (remember price and yields of bonds move inversely). 

Think about it for a moment, when the government reduces interest rates investors are forced to find their required income from some other place.  So they need to take on more risk.  The average retiree gets it because they live it, but many forget that institutions are also required to satisfy unfunded liabilities like pension payments and endowment returns. 

Take a closer look at both charts and you will also notice the date of the worst time to own stocks vs. bonds.  You can see the EYS dove to -5.7 below on October 9th 1987.  That was 10 days before the worst stock market crash in modern history. So while this is not infallible by any stretch of our imagination, I think it has some validity to overweighting one asset class vs. another when it signals along with some other gauges. 

CHART #2 Source: Forbes.com

Chart #2 provides a closer viewpoint of our current spread.  I have heard indications by strategists of the spread approaching 8 in the last quarter.  A reading of 8 would be of historic proportions, because it has only happened 3 times in the last 140 years of stock market history.

  1. Around the time of Francis Ferdinand Assassination 1914 (beginning of WWI).
  2. Post WWII recession period 1946/48 when demand fell out of bed (since the war machine was being dismantled and yields on bonds were low but fear was still on the minds of investors). 

During the first two instances, just like now, there was a good reason for fear in the world and we went into two very ugly world wars.  However, in hindsight, they were very good points to enter the equity markets.  

In general, long-term investors were handsomely paid if they began to purchase and continued to purchase equity positions vs. bond positions when the Earnings Yield Spread was high.  That disparity between equity return expectations is one of the reasons The Center determined to stay fully invested in our equity exposure during the summer and fall of 2011.  So, the moral of the story is to buy tuna (or stocks, as the case may be) when it is being sold at a discount.  And if the price is considerably less than your other protein options and you like it…maybe buy a little more.  But for heaven sakes, it’s not time to give up tuna altogether!


The Death of Diversification

I’ve got three words for you: “Diversification, Diversification, Diversification!”

Since the dawn of Modern Portfolio theory, the benefits of non-correlation with favorable impact to risk and return have created a mantra for investors. At Center for Financial Planning, we agree!

We’re not alone. As I worked on this blog, I did a quick Google search for diversification and investing. At the top of the list was a post from the SEC on “The Magic of Diversification”. Here’s an excerpt:

Source: sec.gov, Beginners Guide to Asset Allocation, Diversification, and Rebalancing

At this point, the mantra is ringing in your head and you’re saying, “Yes! I know this. This is a fundamental lesson for investors.”

But, wait! In 2011, diversification largely left investors begging for more. A plain vanilla, decidedly undiversified mix of the S&P 500 and Bar Cap Aggregate bond indexes outperformed a more broadly diversified mix of assets including portfolios that included international investments, small company stocks, diversified types of bonds, and commodities.[1]

What’s an investor to do? As with anything, no investment strategy is foolproof including diversification, especially in the short run. But what your heart tells you in a period of underperformance is to stick with what’s worked recently (or bail on the mantras if they aren’t working right now). This time is different! After all, Europe looks scary! Historically, periods of diversification underperformance have been followed by outperformance. Investment thinker Robert Arnott of Research Affiliates tracks a diversified portfolio of 20 asset classes. After the 3rd quarter of 2011, the year’s worst, Arnott noted the significant underperformance of his diversified benchmark as compared to a 60/40 S&P/Bar Cap Agg portfolio.

The question for investors today is what may happen going forward. Past performance cannot predict future turns. Arnott notes, though, that in the past, following significant periods of underperformance for diversification, diversified portfolios have outperformed.


[1] Comparison of 60% S&P 500/40% Bar Cap Aggregate Bond to 30% S&P 500/10% Russell 2000/15% MSCI EAFE/5% DJ UBS Commodity/30% Bar Cap Aggregate/10% Bar Cap US Corporate Index. All index returns via Morningstar.com. Index compositions: The Barclays Capital U.S. Aggregate Index represents securities that are SEC-registered, taxable, and dollar denominated. The index covers the U.S. investment grade fixed rate bond market, with index components for government and corporate securities, mortgage pass-through securities, and asset-backed securities. The Dow Jones-UBS Commodity Index is composed of futures contracts on physical commodities and represents nineteen separate commodities traded on U.S. exchanges, with the exception of aluminum, nickel, and zinc. The Barclays Capital Corporate Bond Index is the Corporate component of the U.S. Credit index. The S&P 500 Index is a representative sample of 500 leading companies in leading industries of the U.S. economy. The Russell 2000 Index ® measures the performance of the 2,000 smallest companies in the Russell 3000 Index. The MSCI® EAFE (Europe, Australia, Far East) Net Index is recognized as the pre-eminent benchmark in the United States to measure international equity performance. It comprises 21 MSCI country indexes, representing the developed markets outside of North America. Index definitions via JP Morgan Asset Management Guide to the Markets January 2012.

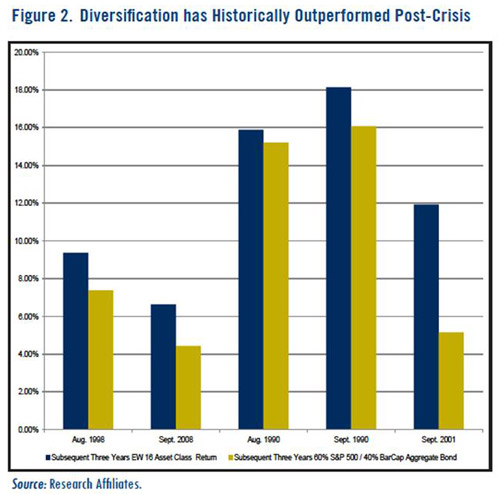
 Building the 3-D Shelter, Rob Arnott, October 2011

* Diversified benchmark refers to the EW 16 Asset Class Portfolio composed of the following 16 components in equal weights: DJ UBS Commodity TR, Credit Suisse Leveraged Loan, BarCap US Corporate High Yield, BarCap US Treasury US TIPS, BofAML Convertible Bonds, FTSE NAREIT, JPM ELMI+, MSCI Emerging Markets, Russell 2000, MSCI EAFE, S&P 500, JPM EMBI, ML US Corp & Govt, BarCap US Long Credit, BarCap US Agg Bond, BarCap US Treasury Long. 

Will 2012 restore your faith? Don’t count out the potential benefits of broad and divergent investments within a single portfolio. As your head bargains with your heart for patience, keep historical lessons of diversification in mind!


The information contained in this report does not purport to be a complete description of the securities, markets, or developments referred to in this material.  The information has been obtained from sources considered to be reliable, but we do not guarantee that the foregoing material is accurate or complete. Any information is not a complete summary or statement of all available data necessary for making an investment decision and does not constitute a recommendation.  Any opinions are those of Center for Financial Planning, Inc., and not necessarily those of RJFS or Raymond James. Expressions of opinion are as of this date and are subject to change without notice.  Past performance may not be indicative of future results. Please note that international investing involves special risks, including currency fluctuations, differing financial accounting standards, and possible political and economic volatility.  Investing in small-cap stocks generally involves greater risks, and therefore, may not be appropriate for every investor.  There is an inverse relationship between interest rate movements and bond prices.  Generally, when interest rates rise, bond prices fall and when interest rates fall, bond prices generally rise.  Commodities and currencies investing are generally considered speculative because of the significant potential for investment loss. Their markets are likely to be volatile and there may be sharp price fluctuations even during periods when prices overall are rising.  Dividends are not guaranteed and must be authorized by the company’s board of directors.  Every investor’s situation is unique and you should consider your investment goals, risk tolerance and time horizon before making any investment.  Investing involves risk and you may incur a profit or loss regardless of strategy selected.  The foregoing is not a recommendation to buy or sell any individual security or any combination of securities. 

Where is the Love?

At least for dividends, there doesn’t seem to be any love in the headlines.  From CNBC at the first of the year they wrote, “Market’s Flat 2011 Could Imply Rally This Year.  Following last year’s pancake-flat finish on the S&P 500…”  And there were many others like this.  If you didn’t investigate further you probably wouldn’t even realize that the S&P 500 was up last year.  The S&P finished positive 2.1% on a total return basis. 

How, you may ask, did this happen?

Many of the stocks in the S&P 500 index pay dividends.  The total yield on the S&P 500 was 2.3% as of 12/31/11 and these are payments made directly to the shareholder in cash, or one can choose to reinvest them.  This must also be counted in your return, but many seem to overlook this fact. 

Dividends can provide a potential source of income to help cushion portfolios in down markets and potentially bolster returns during up markets.


While 2% may seem like a pittance compared to fluctuations in stock values, between 1926 and 2009 these small payouts have generated about 40% of overall return in the S&P 500 (WSJ, A Time for Dividends, 10/5/11) and can be vital to achieving long term financial planning goals. 

* Investor’s cannot invest directly in an index.  Past performance is not indicative of future results.The information contained in this report does not purport to be a complete description of the securities, markets, or developments referred to in this material.  The information has been obtained from sources considered to be reliable, but we do not guarantee that the foregoing material is accurate or complete.  Any opinions are those of Center for Financial Planning, Inc., and not necessarily those of RJFS or Raymond James.  Expressions of opinion are as of this date and are subject to change without notice.  Dividends are not guaranteed and must be declared by a company’s board of directors.

Time to Declutter?

Do you ever feel like this when thinking of your portfolio?  Making investments without factoring in your investment process could end up adding more clutter to your portfolio without adding any value.

As you might recall the investment process starts with Strategic Asset Allocation, which is the establishment of your mix of stock, bonds and cash (see my post from 11/4/11).  Followed by layering in tactical allocation, overweighting or underweighting asset classes as the opportunity arises (see my post from 12/2/11).

Choosing the proper type of investment is vital to the continuation of your process.   There are many different types of investments that may be appropriate for you.  Individual company stock is usually the first that comes to mind for investors.  Common stock represents direct equity ownership in a corporation.  Returns can come from dividends paid or price appreciation.

One could also purchase bonds issued by many of these same companies, as well as governments or municipalities.  This means the entity owes you your principal at a specified date in the future and interest in the mean time in exchange for borrowing from you.  Many factors need to be considered when investing in a stock or bond and this can be overwhelming even for many investment professionals.  So many investors turn to professional money management.

Professional money managers can take two basic approaches to investing.  First, active management is simply an attempt to "beat" the market as measured by a particular benchmark or index.  Passive management is more commonly called indexing. Indexing is an investment management approach based on investing in exactly the same securities, in the same proportions, as an index.

So if you find yourself buried in stacks of paper every month talk to your Investment Professional to de-clutter your portfolio and determine which types of investments may be appropriate for you.

Dividends are not guaranteed and must be authorized by a company’s board of directors.  Bond prices and yields are subject to change based upon market conditions and availability.  If bonds are sold prior to maturity, you may receive more or less than your initial investment.  Holding bonds to term allows redemption at par value.  The information contained in this report does not purport to be a complete description of the securities, markets, or developments referred to in this material.  Any information is not a complete summary or statement of all available data necessary for making an investment decision and does not constitute a recommendation.