

 It's election season…again! While the mudslinging between candidates and special interest groups ramps up, how will the stock markets react?
History suggests that investors can benefit from paying attention to the presidential election cycle. Yale Hirsch, a stock market historian and the creator of the Stock Trader’s Almanac, has developed the presidential election cycle theory. This study, among others, supports evidence that there is a significant relationship between the presidential cycle and the stock market.
Here is what returns look like on the average election cycle verses our current election cycle:
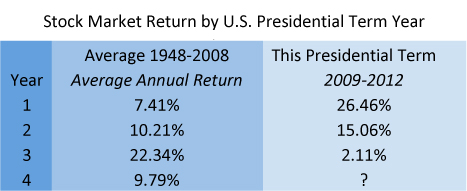 Source: S&P500 Total Return Index
Year 1: The Post-Election Year
Of the four years in a presidential cycle, the first-year performance of the stock market, on average, is the worst; however, so far with the current administration, it has been the best. We recovered sharply immediately following the financial crisis of 2008.
Year 2: The Midterm Election Year
The second year, although historically better than the first, this time has trailed the strong performance of the first year.
Year 3: The Pre-Presidential Election Year
The third year (the year proceeding the election year) is the strongest on average of the four years, but with the European concerns, ended up being the worst of the cycle so far.
Year 4: The Election Year
In the fourth year of the presidential term and the election year, the stock market's performance tends to be above the overall average.
While the current cycle seems to be turned on its head, it is still worth exploring different election scenarios and how they affect the markets.
- What if a Democrat wins? What if a Republican wins?
- What if the race is close? What if it is a landslide?
- Can the stock market predict an election winner?
While the candidates are busy posturing for the election, we will explore some scenarios and how to posture your portfolio accordingly in the coming weeks.
The S&P 500 is an unmanaged index of 500 widely held stocks that’s generally considered representative of the U.S. stock market. Keep in mind that individuals cannot invest directly in any index, and individual investor’s results will vary. Past performance does not guarantee future results. The information contained in this report does not purport to be a complete description of the securities, markets, or developments referred to in this material. The information contained in this report does not purport to be a complete description of the securities, markets, or developments referred to in this material. The information has been obtained from sources considered to be reliable, but we do not guarantee that the foregoing material is accurate or complete. Any information is not a complete summary or statement of all available data necessary for making an investment decision and does not constitute a recommendation. Any opinions are those of Center for Financial Planning, Inc., and not necessarily those of RJFS or Raymond James.