![]() Contributed by: Angela Palacios, CFP®, AIF®
Contributed by: Angela Palacios, CFP®, AIF®
 Contributed by: Nicholas Boguth, CFA®, CFP®
As the 4-year anniversary of the Covid stock market correction came and went last month, markets have given historians and economists much to reflect on. Since the consumer is the major driver of the U.S. economy, the aftereffects of the COVID-19 pandemic stay-at-home policies and the economic reopening policies meant it has taken several years for a recession to roll through the economy. This uncorrelation of the sector effects has made this business cycle feel quite different. For example, when staying at home, we shifted our spending to either saving money or spending on goods rather than services, causing a major recession and unemployment in the services industry (remember when we couldn’t travel and instead spent our money on things like a Peloton!). Once herd immunity was achieved, we shifted our spending patterns from goods to services and travel, causing recessionary characteristics to roll through the manufacturing industry. This lack of synchronization has caused the NBER (National Bureau of Economic Research) to not call a recession here in the U.S. even though we met the official definition of one back in 2022 of two negative quarters of GDP growth (Gross Domestic Product).
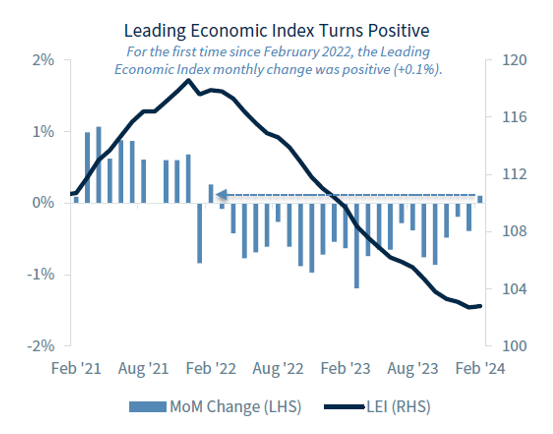
Recently, the manufacturing numbers, as measured by the ISM index (a leading economic indicator), finally climbed out of recessionary territory (below 50 readings) after a 16-month continuous streak of contractions. This is the longest contractionary steak since 2002! If you couple this with a recovery in new home building permits (another leading indicator), it looks more and more likely that the Federal Reserve has been successful in engineering a soft landing. The Conference Board Leading Economic Index also rose in March for the first time in two years!
The stock market agrees as the year has started out very strongly, with U.S. stocks up over 10.5% as measured by the S&P 500, U.S. small company stocks up 5.2% as measured by the Russell 2000, and International stocks up 5.78% as measured by the MSCI EAFE. Bonds were off to a slower start, down .78%, as the market reset expectations of the number of interest rate hikes that are likely to occur this year.
As the S&P 500 hits new highs, it is natural that you might be wondering if the market is too expensive. Investing at all-time highs seems like the wrong time to add to your investments. Check out my recent blog for some interesting statistics on forward returns when investing on days the market is making a new high. The moral of the story, though, is that while valuations are expensive, they do NOT necessarily mean the market will crash tomorrow, next quarter, or even next year. Current valuations are usually a poor indicator of how markets will perform in the short run. It is important to set reasonable expectations of future market returns. This is not the same market we have seen over the past couple of years driven by a few concentrated names. Returns have broadened across the benchmark, and political headlines may start to creep into market performance in the short term.
Investing by Political Party: A Long-Term Perspective
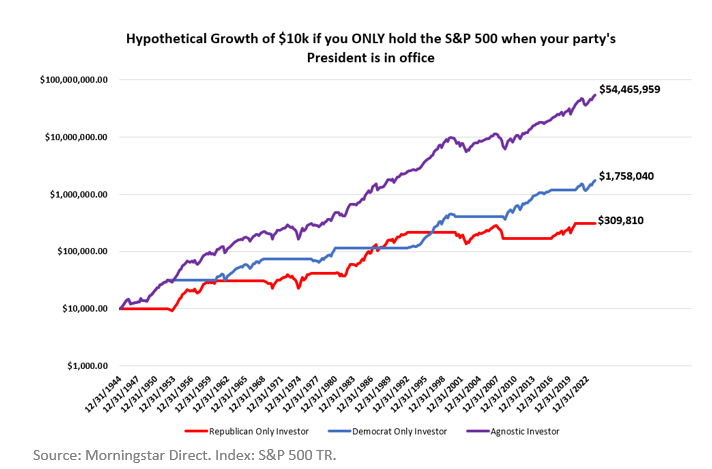
What if you ONLY invest in the stock market when your president is in office? Over the past 80 years, the political party-agnostic investor beats the democrat and republican by ~3,000% and ~17,500%!
OK, this may fall under the “lying with statistics” category, but I think it still illustrates two very important points. Stocks don’t grow because of political parties, and time in the market is the single most important factor in growing your investment.
Let’s consider three hypothetical investment strategies starting with $10,000 in 1945:
Republican Only Investor: puts 100% of their money into the S&P 500 when the president is a Republican, otherwise hides their money under their mattress.
Democrat Only Investor: puts 100% of their money into the S&P 500 when the president is a Democrat, otherwise hides their money under their mattress.
Agnostic Investor: puts 100% of their money into the S&P 500 the entire time.
The results may shock you. The “Republican Only” investor ends up with ~$309k, the “Democrat Only” investor ends up with ~$1.75M, and the “Party-Agnostic” investor ends up with a whopping ~$54.5M.
Obviously, this hypothetical is a bit outlandish for a few reasons. It has an 80-year time horizon, which is much longer than most people are seriously investing. It is an all-or-nothing strategy that puts all its eggs in one basket or the other. One of those baskets earns 0% (which isn’t realistic if you compare it to money markets or short-term treasuries over time). And lastly, it might lead one to confuse correlation and causation when looking at the Democratic/Republican gap.
It would be easy to point to this as confirmation that the Democratic party is better for stocks, but digging a little deeper makes it less clear. The lead changes throughout history – if we wrote this in the 1990s, someone could point to it as confirmation for the Republican party and stock performance. Aside from that, the gap comes from two very distinct decades: the 2000s that gave investors one of the worst decades of stock returns in history, and the 2010s that gave investors one of the best. Lively debates are still happening today over what caused the Tech Bubble, the Great Financial Crisis, and subsequent recovery – but there were certainly more factors than one. In the long run, stocks grow because earnings grow, and earnings have much more to do with innovation and economic growth than those sitting in the Oval Office.
The second and even more important point is that the best way to partake in those growing stock earnings is, unsurprisingly, to invest in stocks! The chart below uses the same data as the previous chart but only shows the time each investor invested in stocks. Each party held office for almost exactly half of the time, so missing out on the other half was a HUGE detriment to results for both investors.
The Fed, Interest Rates, and Bond Returns
The Fed ended the fastest rate hike cycle in history last summer when they made the final hike to 5.25-5.5%. Since then, the bond market has been trying to pinpoint exactly when the first interest rate CUT would come. March? June? Later? Expectations have been shifting later than initially predicted. You can see that in the rising interest rates the past few months – the 1-year treasury rate was around 4.7% in January but back to 5% by the end of the quarter. What does all this ACTUALLY mean for bond investors, though?
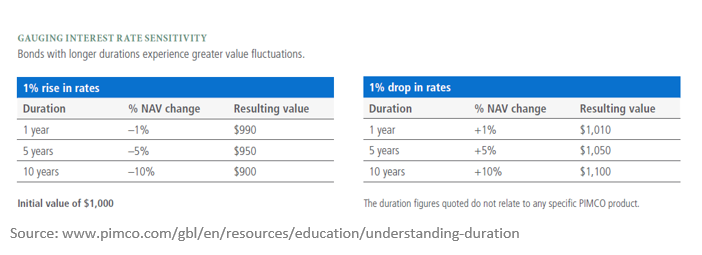
Well, the Fed doesn’t control the entire yield curve – they only have a direct impact on the shortest durations of bonds at the front end of the curve. If you are invested in those short duration bonds, you will probably see the yields fall as the Fed cuts, but the prices of short duration bonds do not move nearly as much as longer duration bonds. Money market funds, for example, have become very popular over the past two years as rates have increased. Roughly speaking, if the Fed cuts rates from 5.5% to 4.5% over the next year, a money market investor would likely see their yield fall a similar 1% but wouldn’t see any price appreciation (they also wouldn’t likely see any price DEPRECIATION if yields were to rise).
Intermediate and long-term bond investors have more factors to consider because those durations are much more volatile and move with longer term economic growth expectations as well as inflation expectations. Just because the Fed cuts rates does not necessarily mean that the 10-year rate would also decrease. BUT if it did, that investor would see significant price appreciation. The flip side to that, as we all saw in 2022, is that those investors saw significant price depreciation as rates rose.
So, What May Be Coming This Quarter?
Presidential Primary races will continue throughout this quarter, concluding in early June, but with all opponents dropping out of the race, it looks like we will repeat the 2020 election of Donald Trump and Joe Biden. Market driving election headlines are likely to be minimal for now but may start to play into market performance in the short term. Holding the cash you may need in the next year, lengthening the duration of our bonds – to potentially offset equity market volatility, and rebalancing are all tools we are deploying to take advantage of or insulate against short-term market volatility.
Next month, the SEC will shorten the standard trade settlement cycle from two business days to one business day after the trade date. This reduces the time between when a sale of a security occurs and when the proceeds are cleared for withdrawal.
Portfolio spring cleaning? Much like moving through the rooms in your house with a critical eye, the investment committee is focused on reviewing asset classes within the portfolio. We are focused on extending the duration of our bond portfolio with a partial change having already occurred. We will also be doing a deep dive into our international investments.
We are grateful for the opportunity to guide you throughout your investment journey. If you ever have any questions, don’t hesitate to contact us!
Angela Palacios, CFP®, AIF®, is a partner and Director of Investments at Center for Financial Planning, Inc.® She chairs The Center Investment Committee and pens a quarterly Investment Commentary.
Nicholas Boguth, CFA®, CFP® is a Senior Portfolio Manager and Associate Financial Planner at Center for Financial Planning, Inc.® He performs investment research and assists with the management of client portfolios.
The Composite Index of Leading Indicators, otherwise known as the Leading Economic Index (LEI), is an index published monthly by The Conference Board. It is used to predict the direction of global economic movements in future months. The index is composed of 10 economic components whose changes tend to precede changes in the overall economy.
Any opinions are those of the Angela Palacios, CFP®, AIF® and Nicholas Boguth, CFA®, CFP® and not necessarily those of Raymond James. The information contained in this report does not purport to be a complete description of the securities, markets, or developments referred to in this material. There is no assurance any of the trends mentioned will continue or forecasts will occur. The information has been obtained from sources considered to be reliable, but Raymond James does not guarantee that the foregoing material is accurate or complete. Any information is not a complete summary or statement of all available data necessary for making an investment decision and does not constitute a recommendation. Investing involves risk and you may incur a profit or loss regardless of strategy selected. The S&P 500 is an unmanaged index of 500 widely held stocks that is generally considered representative of the U.S. stock market. The MSCI EAFE (Europe, Australasia, and Far East) is a free float-adjusted market capitalization index that is designed to measure developed market equity performance, excluding the United States & Canada. The EAFE consists of the country indices of 22 developed nations. The Bloomberg Barclays US Aggregate Bond Index is a broad-based flagship benchmark that measures the investment grade, US dollar-denominated, fixed-rate taxable bond market. Keep in mind that individuals cannot invest directly in any index, and index performance does not include transaction costs or other fees, which will affect actual investment performance. Individual investor's results will vary. Past performance does not guarantee future results. Diversification and asset allocation do not ensure a profit or protect against a loss. Investing involves risk and you may incur a profit or loss regardless of strategy selected. Past performance is not a guarantee or a predictor of future results. Raymond James and its advisors do not offer tax or legal advice. You should discuss any tax or legal matters with the appropriate professional.


