Investment Perspectives

Q3 2025 Investment Commentary

The Center Contributed by: Center Investment Department

Print Friendly and PDF

The third quarter of 2025 was one for the record books. The S&P 500 hit new all-time highs 23 times during the quarter. That is the most new highs in a single quarter since 1998! Bonds and small company stocks did not want to be left behind. The Russell 2000 set its own first record high since 2021, and the Bloomberg Aggregate Bond index moved higher for the 3rd straight quarter. Developed international and emerging markets also continued their strong start to the year. For more details, check out our blog. This means that this year has been great for diversified portfolios, which have taken less risk than the S&P 500 but logged nearly as high returns for a 60% Stock/40% Bond portfolio (40% Bloomberg Aggregate Bond index, 40% S&P 500, and 20% MSCI EAFE International index).

Muted Inflation and Interest Rate Cut

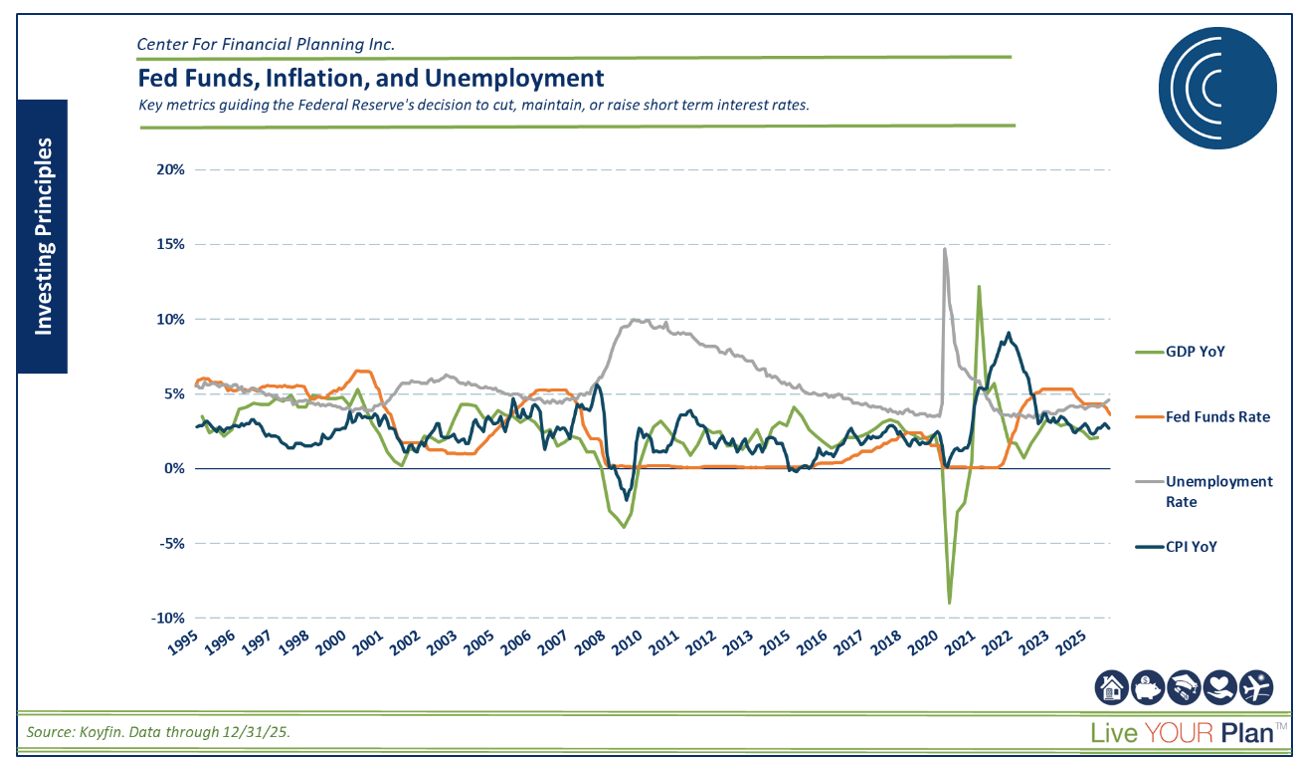
While inflation is tempered for now (even though it lingers above the 2% Fed target), we will likely see it rise in the coming months. Tariffs will cause upward pressure, but low energy prices, declines in shelter inflation, and global economic sluggishness should mitigate the rise.

The Federal Reserve (The Fed) began cutting interest rates again, citing a sluggish labor market.  The first cut of .25% occurred in September and is likely to be followed by 1 or 2 more .25% cuts this year. The Fed will continue to let data drive its decision-making here. The only issue with this is that some data points may be very delayed due to the government shutdown. Lower rates will mean lower money market interest rates, but should also lead to a welcome reduction in mortgage interest rates. 

Tariffs

Tariff revenue is starting to ramp up. Both August and September reports indicate that monthly revenue was over $31 billion each month. Our weighted average tariff revenue in the U.S. is sitting just over 15% compared to just 2.5% in February of this year. As an example, if a 20% average tariff rate were in place for the next 12 months, the U.S. Treasury could collect over $600 billion, which exceeds taxes received from corporations! It remains to be seen how companies will manage this, whether they absorb the hit to their bottom line or pass it along to consumers. Given enough time, companies will also find strategies to mitigate, such as onshoring production or shifting production to countries with lower tariff rates, to stay competitive.

While tariffs were ruled unlawful by lower courts, this case is now in the Supreme Court’s hands, and it could take several months before a final ruling. So they are here to stay for the time being.

Government Shutdown

As of October 1st, the U.S. government has officially entered a shutdown—its first in nearly seven years since the record-breaking 35-day standoff in 2018. The impasse stems from Congress’s failure to pass a budget, driven by partisan disagreements over healthcare funding and proposed federal spending cuts. This has led to disruptions across key agencies, such as the Bureau of Labor Statistics, which has delayed vital economic data and raised concerns about the Federal Reserve’s ability to make informed monetary policy decisions. While this shutdown carries unique weight due to the administration’s push for permanent layoffs and structural changes, investors are reminded that volatility often presents opportunity. Shutdowns are typically brief, averaging just nine days and usually create openings for disciplined investors to reassess and rebalance.

As illustrated in the chart below, the S&P 500 has consistently trended upward in the months following past shutdowns. Despite initial turbulence, markets have shown remarkable resilience, frequently rebounding once political uncertainty fades. 12-month gains following the 20 shutdowns over the past 50 years have averaged 13%, with positive performance 85% of the time! Shutdowns may feel unsettling in the moment, but history offers a reassuring perspective: portfolios anchored in strong fundamentals tend to weather political disruptions better than reactive strategies. Staying diversified and focused on long-term goals remains the most effective approach. The chart serves as a powerful visual reminder that staying the course has historically paid off, even when headlines suggest otherwise.

Investing at All-Time Highs

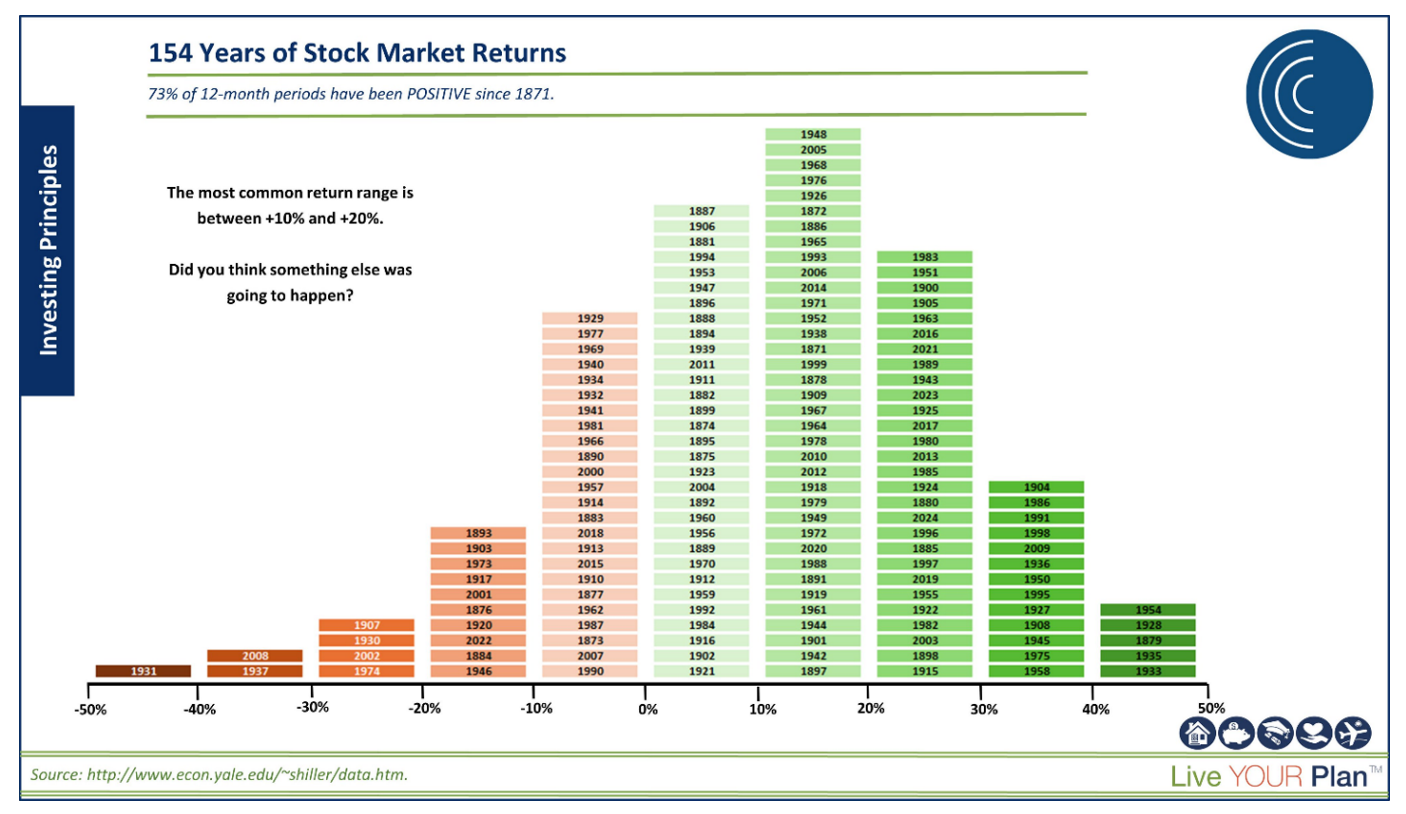
We are navigating this current stock market with two competing narratives. One screams, “sell!” as valuations continue to rise to historic levels despite a weakening labor market, increased tariffs, and uncertain global trade. The other screams, “buy!” as consumers remain strong, the Fed begins cutting rates, companies continue to grow earnings, and the excitement around productivity gains from A.I. continues to accelerate. Whatever your opinion on the stock market, the fact is that the S&P 500 continued to make new all-time highs this quarter – which is NOT an indicator that stocks need to fall. On the contrary, all-time highs tend to be followed by…more all-time highs. With that being said, it is understandable to be concerned or have a cautious outlook on equity markets going forward. When times feel extra uncertain, we lean on our process, historical precedent, diversification, emergency cash reserves, and strong financial planning to provide comfort and give us the conviction we need to stick to the plan.

Gold’s Strong Performance

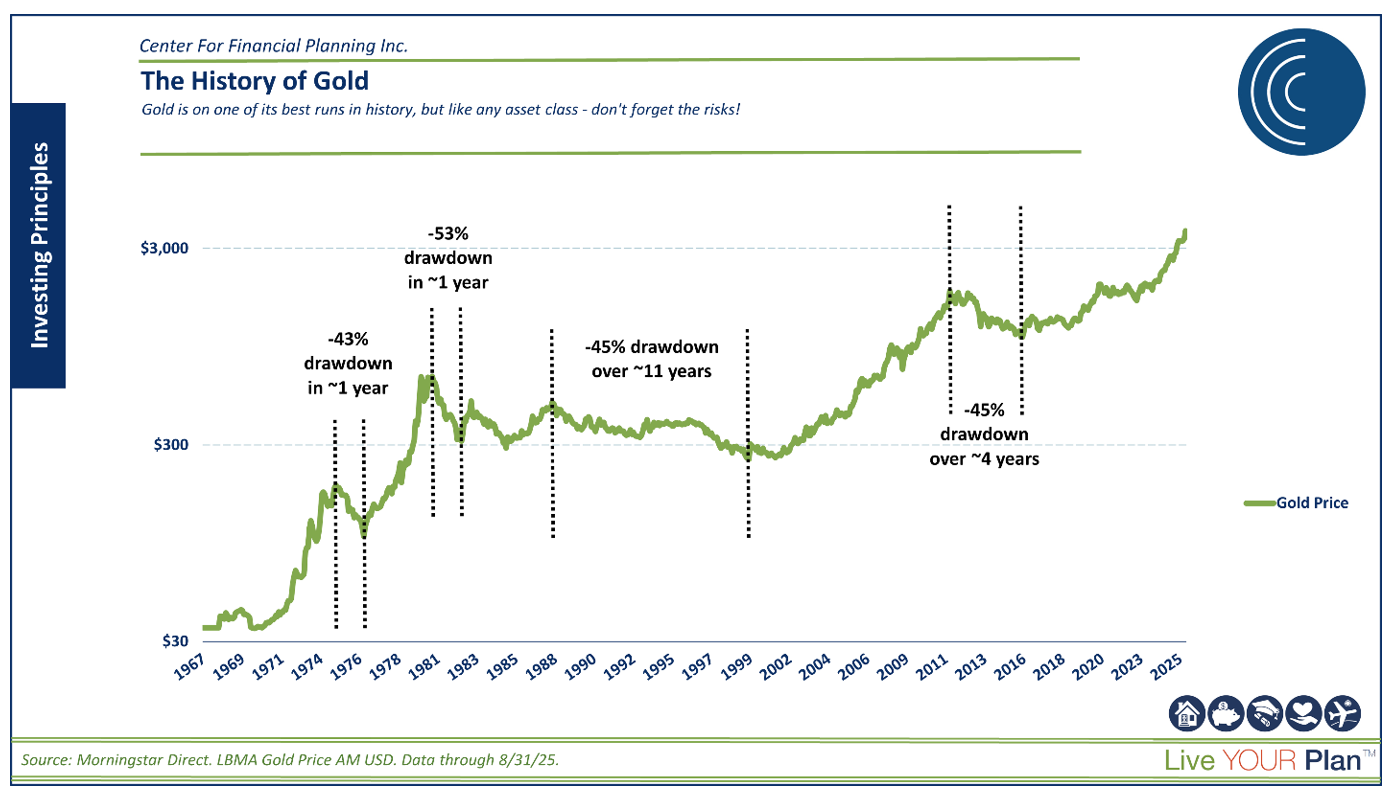
The remarkable run-up in gold prices this year also speaks to the themes of uncertainty and opportunity in today’s investment landscape. By the end of this quarter, gold had risen above $3,800 per ounce, marking a staggering 47% gain year-to-date and setting repeated record highs amid rate cuts, rising deficits, geopolitical tensions, and government shutdowns. Will it reach a historic new level and surpass $4,000 this year? Maybe…that is only another ~5% away. Gold is a volatile investment that typically moves in bursts, and we are currently witnessing one impressive surge. Like any investment, it comes with serious risk, though. Check out the chart below to see some of gold’s historic crashes.

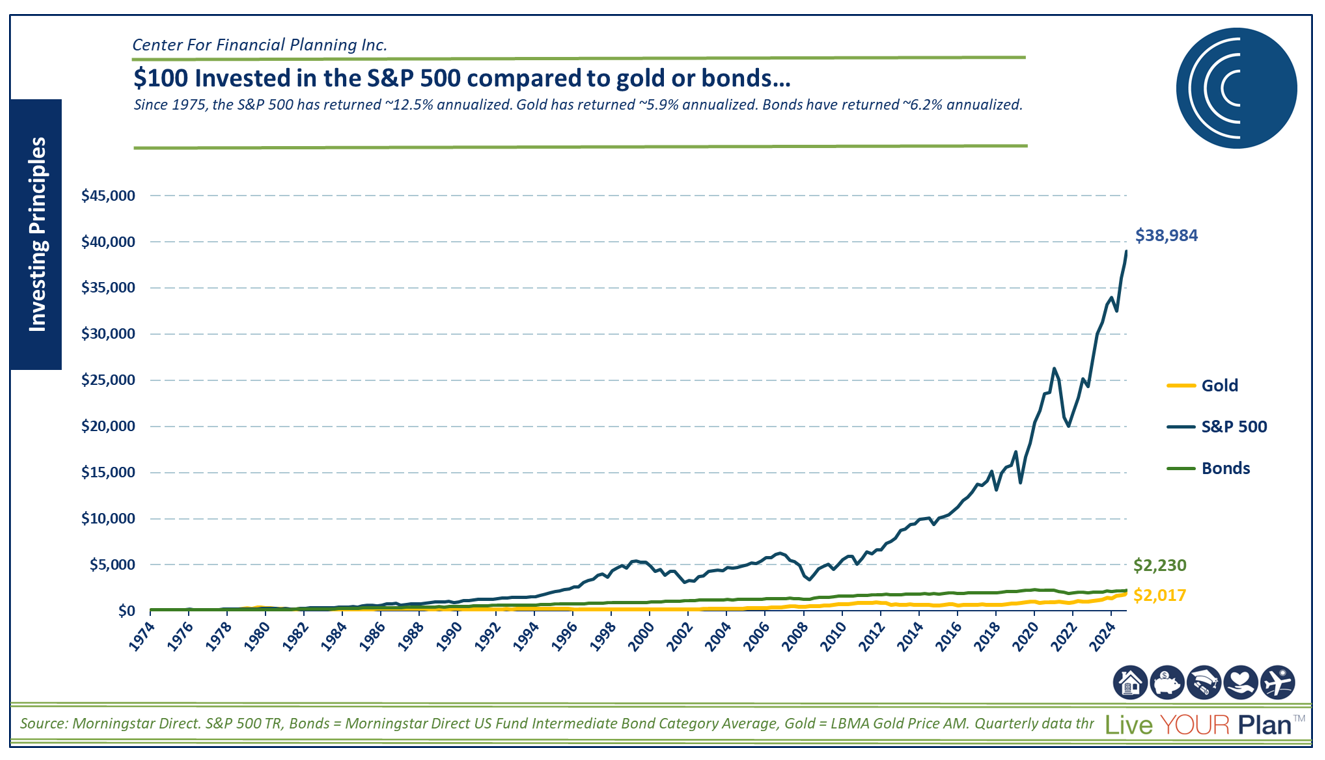
It has had multiple periods where it was cut in half over YEARS. It can have beneficial attributes in an investment portfolio due to its uncorrelated nature, but no investment is perfect, so consider the risks before allocating or chasing performance. Also, keep in mind the long-term performance of gold vs. stocks and bonds.

As we enter the final stretch of 2025, your financial plan is prepared for what the markets may throw our way. Six months ago, on April 2nd, Liberation Day, the tariff plan was rolled out. This caused a sharp correction in markets, but almost as sharp a recovery. If you blinked, you probably missed it. It is an important reminder not to make knee-jerk reactions with your portfolio during these times of volatility, as you could quickly be left on the sidelines waiting for your re-entry point, especially when markets soar to new highs, as they have this year. If you have any questions, we are always here for you. Please don’t hesitate to reach out to us!

Any opinions are those of Angela Palacios, CFP®, AIF®, Nick Boguth, CFA®, CFP®, and Mallory Hunt and not necessarily those of Raymond James. The information contained in this report does not purport to be a complete description of the securities, markets, or developments referred to in this material. There is no assurance any of the trends mentioned will continue or forecasts will occur. The information has been obtained from sources considered to be reliable, but Raymond James does not guarantee that the foregoing material is accurate or complete. Any information is not a complete summary or statement of all available data necessary for making an investment decision and does not constitute a recommendation. Investing involves risk and you may incur a profit or loss regardless of strategy selected. The S&P 500 is an unmanaged index of 500 widely held stocks that is generally considered representative of the U.S. stock market. The Russell 2000 Index measures the performance of the 2,000 smallest companies in the Russell 3000 Index, which represent approximately 8% of the total market capitalization of the Russell 3000 Index. The MSCI EAFE (Europe, Australasia, and Far East) is a free float-adjusted market capitalization index that is designed to measure developed market equity performance, excluding the United States & Canada. The EAFE consists of the country indices of 22 developed nations. The Bloomberg Barclays US Aggregate Bond Index is a broad-based flagship benchmark that measures the investment grade, US dollar-denominated, fixed-rate taxable bond market. Keep in mind that individuals cannot invest directly in any index, and index performance does not include transaction costs or other fees, which will affect actual investment performance. Individual investor's results will vary. Investing in oil involves special risks, including the potential adverse effects of state and federal regulation and may not be suitable for all investors. Past performance does not guarantee future results. Diversification and asset allocation do not ensure a profit or protect against a loss. Investing involves risk and you may incur a profit or loss regardless of strategy selected. Past performance is not a guarantee or a predictor of future results. Raymond James and its advisors do not offer tax or legal advice. You should discuss any tax or legal matters with the appropriate professional.

Investing in gold carries special risks, including wide price fluctuations, a limited market, concentrated sources in potentially unstable countries, and an unregulated market.

Q3 2025: A Quarter of Records & Resilience in the Markets

Mallory Hunt Contributed by: Mallory Hunt

Print Friendly and PDF

The third quarter of 2025 will be remembered as a historic chapter in the ongoing bull market, delivering a standout performance and offering a welcome boost to investor confidence and portfolio growth. Despite ongoing economic headwinds and global uncertainty, investors witnessed a powerful rally. Markets surged to record highs, driven by strong corporate earnings, a strategic rate cut from the Federal Reserve, and the continued dominance of AI-powered growth stocks. This wasn’t just a strong quarter; it was pivotal, signaling a potential turning point in the post-pandemic economic cycle and offering fresh momentum heading into the final stretch of the year. Let’s take a look at some of those record-breaking numbers:

  • The S&P 500 closed above $6600 for the first time, logging 23 record highs, matching the most in any quarter since Q1 1998. Final numbers had the index up 7.79% for the quarter and over 13.72% year-to-date.

  • Nasdaq Composite soared 11.24%, driven by continued momentum in AI-related stocks.

  • Dow Jones Industrial Average rose 5.22%, marking its 8th record high of the year.

  • Russell 2000 small-cap index jumped 12.02%, outperforming large caps and reaching its first record high since 2021.

This remarkable market performance wasn’t just pure luck; several key drivers came together to propel markets to new heights and can be credited as the fuel to this rally:

  • AI Momentum: The “Magnificent 7” tech stocks (Alphabet, Amazon, Apple, Meta, Microsoft, Nvidia & Tesla) continued to dominate, with artificial intelligence innovation driving investor enthusiasm and capital inflows

  • Federal Reserve Rate Cut: The Fed delivered the first rate cut of the year in September, lowering the federal funds rate by 25 basis points and signaling a shift toward a more accommodative policy. This helped ease market concerns and boost investor sentiment.

  • Strong Corporate Earnings: Over 80% of S&P 500 companies exceeded earnings expectations in the second quarter of 2025, which drove investor sentiment in the third quarter and reinforced the strength of U.S. corporations.

  • Global Market Participation: International markets also rallied, with emerging markets outperforming developed ones. Easing trade tensions and supportive policy measures contributed to the global upswing.

As far as sector standouts, leading the quarter’s rally was technology, powered by AI-driven momentum, strong earnings, and expanding valuations. Healthcare demonstrated resilience amid evolving policy landscapes and ongoing innovation. Small-cap stocks outperformed their large-cap counterparts, signaling broader market strength. Growth stocks continued to outpace value stocks, particularly within consumer discretionary and communication services. Meanwhile, safe-haven assets like gold and silver also surged, with gold climbing over 15% and silver approaching its 1980 highs, as investors sought protection against inflation.

While the quarter was overwhelmingly positive, several cautionary factors remain on the radar. Inflation remains above target. Equity valuations have reached elevated levels, prompting concerns that limited earnings growth could cap future gains. Geopolitical and trade tensions persist, including ongoing tariff disputes and global instability, which pose risks to supply chains and investor confidence. Additionally, the current government shutdown will likely delay critical economic data releases, potentially complicating the Federal Reserve’s policy decisions and adding uncertainty to the market outlook.

As we transition into the fourth quarter—a period that historically favors market strength—investors have reason to remain optimistic, while staying mindful of elevated valuation levels and macroeconomic signals. While past performance is never indicative of future results, the momentum from Q3 sets a compelling stage for what could be a potentially dynamic finish to the year. Staying invested and diversified remains key, as disciplined strategies continue to benefit from long-term market trends.

Mallory Hunt is a Portfolio Administrator at Center for Financial Planning, Inc.® She holds her Series 7, 63 and 65 Securities Licenses along with her Life, Accident & Health and Variable Annuities licenses.

The information contained in this blog does not purport to be a complete description of the securities, markets, or developments referred to in this material. The information has been obtained from sources considered to be reliable, but we do not guarantee that the foregoing material is accurate or complete. Any opinions are those of Mallory Hunt and not necessarily those of Raymond James. There is no guarantee that these statements, opinions or forecasts provided herein will prove to be correct. Investing involves risk and you may incur a profit or loss regardless of strategy selected. Every investor's situation is unique, and you should consider your investment goals, risk tolerance and time horizon before making any investment. Prior to making an investment decision, please consult with your financial advisor about your individual situation.

Q2 Investment Commentary - Diversification Delivers Results

Print Friendly and PDF

Key Highlights This Quarter:

  • Diversification Outperforms
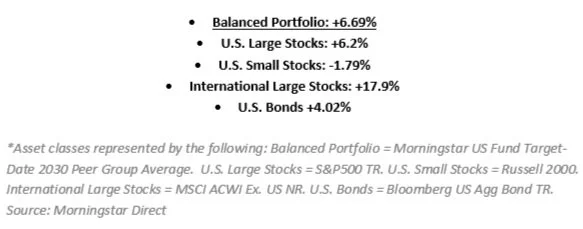
    A balanced portfolio returned +6.69%, outpacing the S&P 500’s +6.2%, while also reducing risk amid market swings.

  • Market Volatility Persists
    The S&P 500 hit new highs, dropped into correction, and rebounded—all within the quarter—highlighting the value of a balanced approach.

  • Tariff Tensions Resurface
    Trade negotiations remain uncertain as the U.S. approaches key deadlines. Tariff revenue is rising, largely funded by U.S. consumers and businesses.

  • “Sell America” Fears Overblown
    Despite April’s rare simultaneous drop in stocks, bonds, and the dollar, foreign demand for U.S. assets remains strong. Bond yields fell, and U.S. equities hit new highs by quarter-end.

  • Credit Rating Downgrade
    Moody’s downgraded the U.S. from AAA to AA1—still strong, but a signal worth monitoring.

  • Consumer Resilience Holds
    TSA screenings, hotel occupancy, and restaurant reservations remain robust, signaling continued consumer strength (Source: Raymond James Up and Adam).

  • Geopolitical Risks Rise
    Escalation in the Middle East caused short-term volatility and a modest rise in gold and oil prices. Historically, such events have limited long-term market impact.

  • GDP Impacted by Imports
    A surge in imports ahead of tariffs dragged Q1 GDP, but underlying consumer demand and inventory growth remain solid.

The first six months of 2025 have been anything but calm—changing government leadership, trade negotiations, global conflicts, and volatile markets have kept headlines spinning. Even the Federal Reserve, after pausing rate hikes, cited 'uncertainty' caused by tariffs. We have watched the S&P 500 hit new all-time highs, fall into correction territory, and then back to new all-time highs in a very short period. A diversified portfolio has provided some welcome risk reduction this year while also outpacing the returns of the S&P 500.

Tariffs

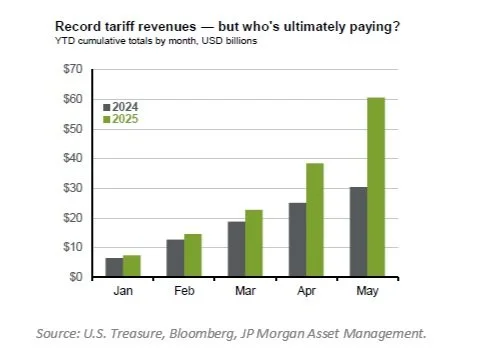
It is likely that we will continue to see volatility as the trade war escalates again, given the approaching expiration of the 90-day negotiation deadlines with various countries. There were numerous headlines surrounding the on-again, off-again tariff situation throughout the quarter. In the second half of the quarter, the legality of certain tariffs has been called into question, but there has been little traction on this issue, and it is a lengthy process to progress through the court system. The Big, Beautiful Bill is counting on about $2.5 Trillion in tariff revenue to offset costs. It is too soon to say if this will materialize, but for now, the worst-case Tariff scenarios seem to be off the table, and with that, consumer sentiment has improved. The very early data below show that in April and May, the government is earning more in tariff revenue than it did the year before. Where is that coming from? Mostly American consumers and businesses.

Best offers from trading partners were due on June 4th. As information becomes available regarding the parameters of certain deals, it is essential to remember that it will be unrealistic to negotiate a deal with every trading partner by July 8th (the 90-day deadline). However, don't get caught up in noise from small trading partners. We should focus most closely on our top 10 trading partners, as they account for 80% of our trade volume. The EU, Mexico, China, and Canada are our top trading partners, collectively accounting for 60% of our trade.

3 possible outcomes after July 9th (most likely a mixture of all 3 as the month continues): 

  1. It could be a nonevent for certain countries with additional deadline extensions ;

  2. It might be a time of celebration of long-promised trade deals;

  3. Or it could be a day for other countries when the hammer comes down, and tariffs are simply dictated again.

Sell America!?

Among the April drawdown post-liberation day, we saw this "sell America" theme emerge. The worry was that investors had collectively lost faith in all things America, which caused a rare occurrence where stocks, bonds, and the U.S. dollar all fell at the same time. While rare, this does not necessarily need to be a red flag. April was a bit of an anomaly compared to a "normal" market environment because President Trump shook up all global trade.

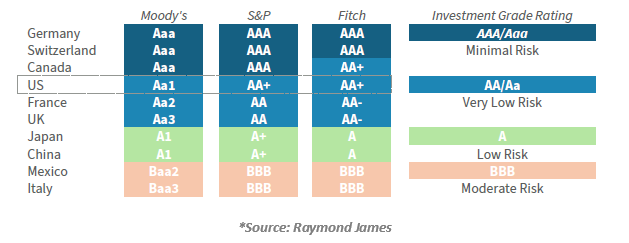
To add to the headlines, Moody's decided in May to move the U.S.A. down one notch on their credit rating system – from AAA to AA1. Still great, but not perfect. Also, it's a worrisome headline.

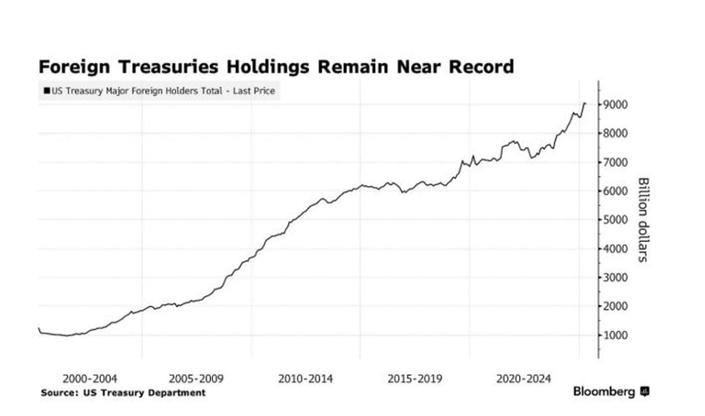
We are not going to ignore the headlines; they COULD be the start of larger themes, but maybe more importantly, we will track the data to see where money is ACTUALLY going. Despite the headlines, Bloomberg reported that foreign banks were still holding more U.S. treasuries than ever. Despite the "sell America" headline, it seems that everyone is still "buying America." Another confirmation of this fact is that bond yields are lower than they were when we started the year. If investors were selling U.S. bonds in mass, you would likely see higher yields. And this is without even mentioning U.S. stocks (while underperforming internationally) were hitting all-time highs at the end of June.

Here is how our new rating stacks up against the rest of the world’s largest economies.

GDP

The decline was driven by a significant surge in imports, which is a subtraction in the calculation of GDP. Imports increased at an annualized rate of 41.3% in the first quarter as companies packed in as many orders as they could ahead of anticipated tariffs from the Trump administration. The surge in imports was good for a -5% contribution to the GDP calculation in the first quarter. Final sales of goods to domestic purchasers, another sign of demand in the economy, grew at a 3% annualized rate in the first quarter, above the 2.9% seen in the fourth quarter of 2024. We saw a huge build in inventories. However, when you examine underlying demand and consumer spending growth, it was still relatively solid.

There are several interesting real-time economic indicators that help determine the health of the consumer, who accounts for 70% of our economy. TSA screenings, Hotel occupancy, and restaurant reservations are all still looking very strong throughout the quarter. People are still going out to travel and eat.

Geopolitical Events

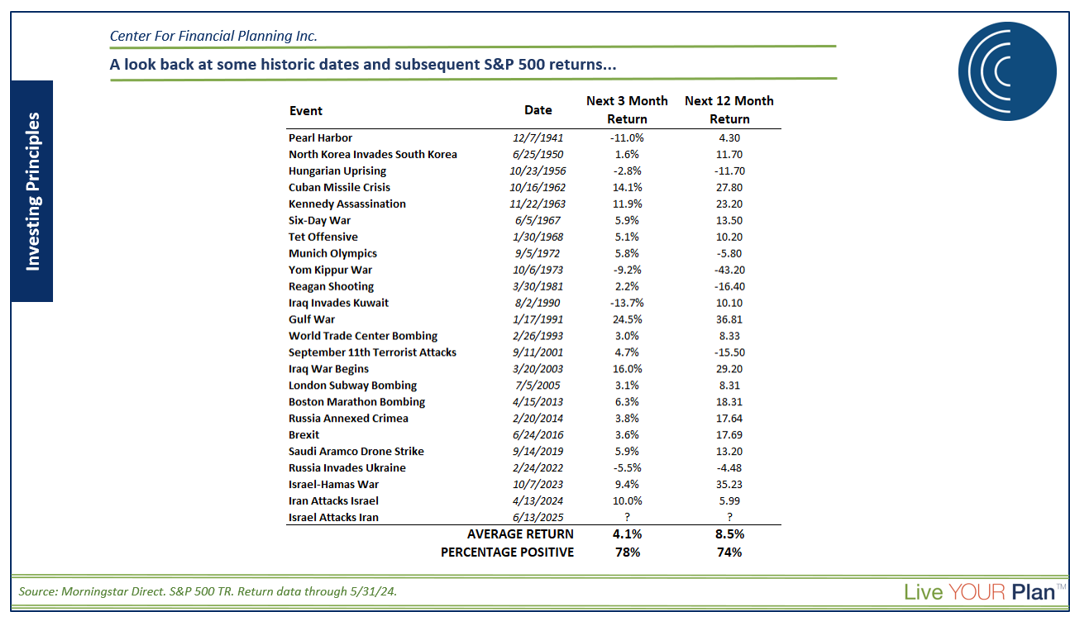
The Middle East conflict between Iran and Israel escalated significantly in June when Israel targeted bombing Iran's nuclear capabilities and the U.S., followed by also striking their nuclear facilities later in June. As a result, we saw some initial volatility, and gold prices climbed modestly again. However, history tells us that events like these, although extremely concerning from a humanitarian perspective, often cause initial stock market volatility but have a minimal impact over the long term. Most of the time, the S&P 500 notches positive returns, with an average annual return of about 8.5% when fast-forwarded 12 months.

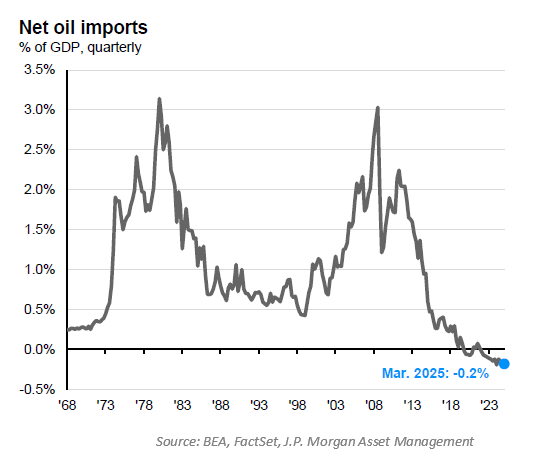
Oil prices also spike as Iran is responsible for supplying a portion of the world's oil. However, it is interesting to note that the U.S. has become far less dependent on importing oil. In fact, we are net EXPORTERS of oil. See the chart below:

As you enjoy these final beautiful summer months, don't hesitate to reach out to us with any questions you may have. We appreciate the trust you place with us; thank you!

Angela Palacios, CFP®, AIF®, is a partner and Director of Investments at Center for Financial Planning, Inc.® She chairs The Center Investment Committee and pens a quarterly Investment Commentary.

Any opinions are those of the Angela Palacios, CFP®, AIF® and Nick Boguth, CFA®, CFP® and not necessarily those of Raymond James. The information contained in this report does not purport to be a complete description of the securities, markets, or developments referred to in this material. There is no assurance any of the trends mentioned will continue or forecasts will occur. The information has been obtained from sources considered to be reliable, but Raymond James does not guarantee that the foregoing material is accurate or complete. Any information is not a complete summary or statement of all available data necessary for making an investment decision and does not constitute a recommendation. Investing involves risk and you may incur a profit or loss regardless of strategy selected. The S&P 500 is an unmanaged index of 500 widely held stocks that is generally considered representative of the U.S. stock market. The Russell 2000 Index measures the performance of the 2,000 smallest companies in the Russell 3000 Index, which represent approximately 8% of the total market capitalization of the Russell 3000 Index. The MSCI EAFE (Europe, Australasia, and Far East) is a free float-adjusted market capitalization index that is designed to measure developed market equity performance, excluding the United States & Canada. The EAFE consists of the country indices of 22 developed nations. The Bloomberg Barclays US Aggregate Bond Index is a broad-based flagship benchmark that measures the investment grade, US dollar-denominated, fixed-rate taxable bond market. Keep in mind that individuals cannot invest directly in any index, and index performance does not include transaction costs or other fees, which will affect actual investment performance. Individual investor's results will vary. Investing in oil involves special risks, including the potential adverse effects of state and federal regulation and may not be suitable for all investors. Past performance does not guarantee future results. Diversification and asset allocation do not ensure a profit or protect against a loss. Investing involves risk and you may incur a profit or loss regardless of strategy selected. Past performance is not a guarantee or a predictor of future results. Raymond James and its advisors do not offer tax or legal advice. You should discuss any tax or legal matters with the appropriate professional.

Q1 2025 Investment Commentary: Diversification Results in Smoother Ride than Headlines Portray

Print Friendly and PDF

The past few months have been a whirlwind—new leadership in Washington, escalating trade tensions, geopolitical conflicts, and market swings have dominated headlines. Even the Federal Reserve noted heightened 'uncertainty' after holding the Fed Funds Rate steady, and that might be an understatement.

The S&P 500 started out steady this year, gaining a few percent by mid-February and reaching a new all-time high! But the short-term whims of the stock market turned from that point as it fell sharply and briefly hit a 10% decline from its peak by mid-March (those famous "Magnificent 7" stocks got hit even harder, the notable one being TSLA that was down a whopping 53% from its high a few months prior). The S&P 500 ended at -4.5% this quarter.

While all that turmoil was occurring in the big U.S. stock names, international stocks were quietly having a fantastic quarter. The MSCI EAFE (a common stock index covering international stocks) was actually positive for the entire quarter, outperforming its U.S. counterpart by over 16% at times and ending the quarter at a positive +8%.

Bonds also did their job and provided the support we want to see during times of volatility, the Bloomberg U.S. Aggregate Bond Index added +3%.

If you were just watching the headlines, it may not have felt this way, but all of that adds up to a balanced portfolio* being essentially flat to start the year. U.S. stocks dragged down performance, while bonds and international stocks were additive. Our ultimate goal has always been to help you achieve your goals; therefore, we continue to focus on the risk reduction benefits of a diversified portfolio, and so far this year, the benefits of diversification have added up to a smoother ride.

*Morningstar's Moderate Allocation category average for the quarter was -0.3%.Source: Morningstar Direct.

Diversification

It is quarters like this that remind us why we invest in diversified portfolios and create a plan BEFORE there is market volatility.

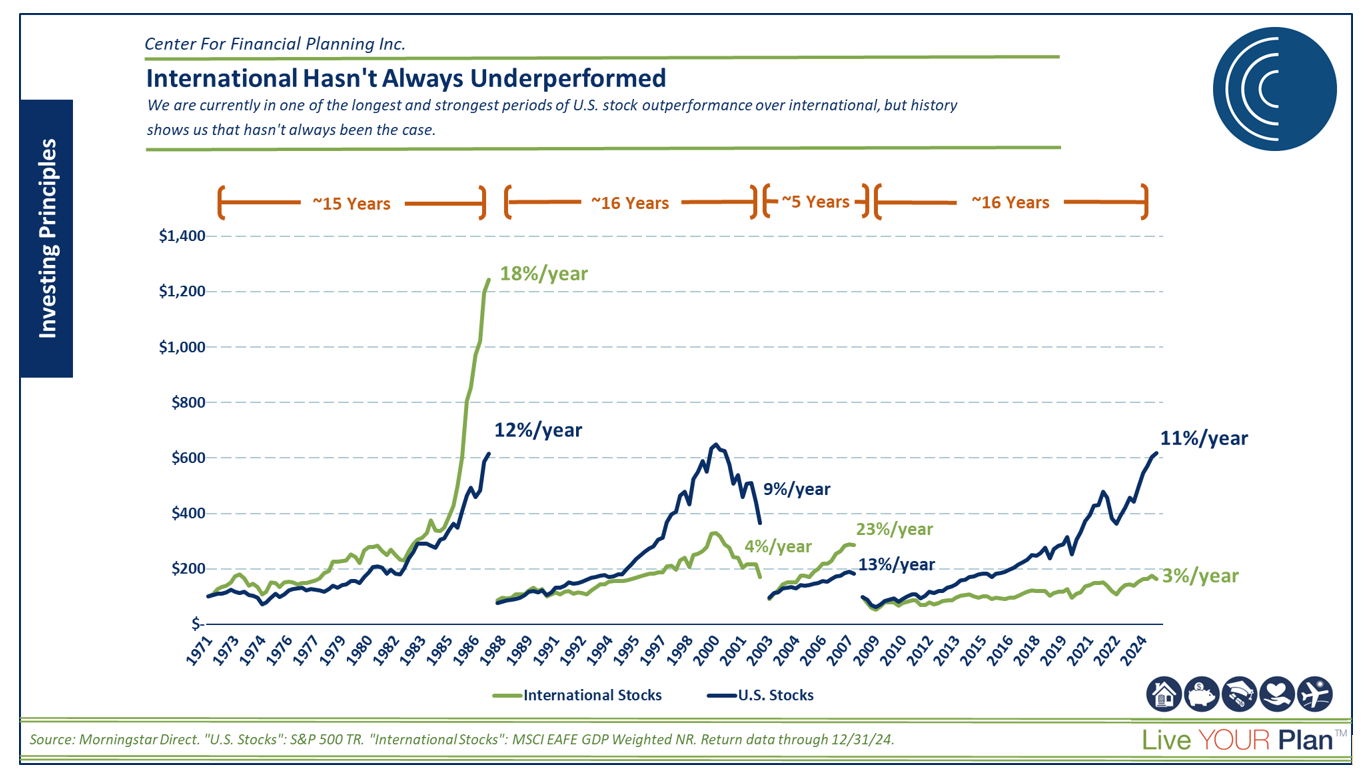
Famed Nobel Laureate Harry Markowitz, whose investment principles still shape how portfolios are created today, said, "Diversification is the only free lunch in investing." We tend to agree, which is why we strongly believe in diversified portfolios. The only pushback I'd give is that it isn't "free"; it is actually very difficult for most investors to stay diversified. The hard part is that there is always a piece of your portfolio lagging, tempting you to second-guess it. Lately, that's been international stocks—but those who stayed the course just reaped the rewards of a quarter where international outperformed by more than 10%. Over the long haul, we believe diversification leads to favorable outcomes for investors, and we will continue to allocate accordingly.

Trade War Deja Vu

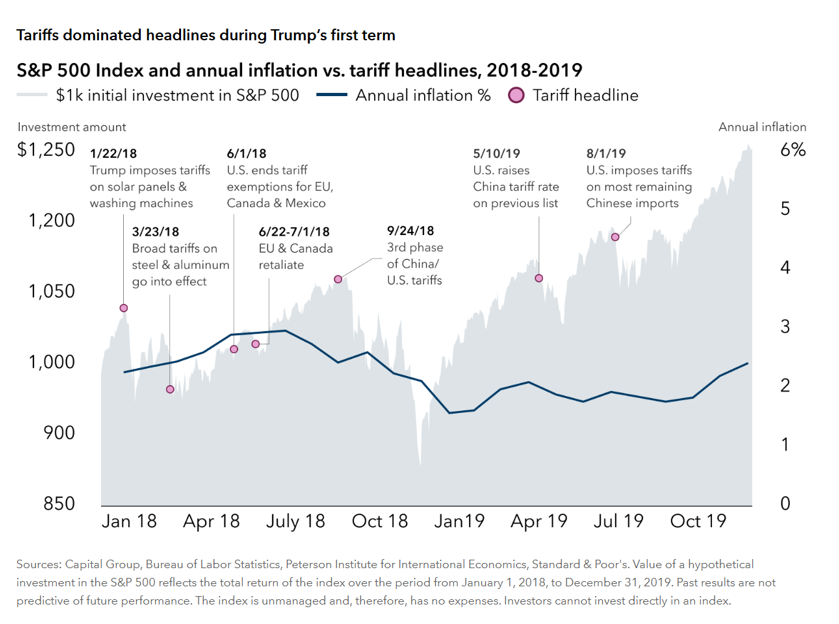
With all of the recent volatility directly induced by the trade war escalation, we have to look backward before deciding what, if anything, to do with portfolios. The most recent time period we have to look at from history is President Trump's first term when he tackled international trade, starting in late 2017 and continuing through into 2019. You can see that as various headlines escalated throughout the year, the market (the gray area) reacted mildly at first and even continued to climb higher through the summer as the war escalated. It is also important to remember that the volatility late in 2018 was not simply induced by the trade war. At the same time, the Federal Reserve (The Fed) took a tighter policy stance, increasing interest rates and giving forward guidance that it would continue to shrink its balance sheet.

The difference this time is we have lived through this before, so markets are reacting poorly and more quickly than they did before. Perhaps because they are remembering what happened in 2018 and the volatility we saw at the end of the year was still fresh in investors' minds. What is lacking in all commentary we read, though, is experts and investors forget we had a HAWKISH Fed that was raising interest rates then. Now, we have a Fed that is expected to cut rates later this year.

How We Are Trading It?

As we have warned previously, media headlines are often wrong or sensationalized. But this doesn't mean that we ignore them and what is happening. As an investment committee, we digest and step back to calmly make decisions when warranted. So, what have we been up to?

  1. Taking profits in positions that have been big winners. This may look different depending on what stage of life you are in and your portfolio needs, but for all, regardless of stage, it's called rebalancing. Rebalancing isn't just a process, it can also be a very tactical tool. We have let our winners run for a long time; once they were overweight, we shifted from US Large cap to areas like bonds (big winners recently) and into areas that underperformed for years like international (also big winners recently). This was done much nearer the market top for US Large before the recent volatility occurred.

  2. Lengthening duration in our bond portfolio now that intermediate term bonds are yielding more than short duration bonds. We harnessed that higher yield for your portfolio. Not to mention, some great price performance induced by market volatility recently too.

  3. Raised cash for those in withdrawal stage. We did this early this year before the drawdown started. Taking advantage of a good start to the year for markets, we made sure people taking withdrawals had ample cash to fund future withdrawals, getting to sell while markets were up rather than being forced to sell down the road into weaker markets if they continued.

Remembering that portfolio management is not an "all or none" process is crucial. It is about positioning yourself to minimize emotional decisions so you can find the "opportunity" that exists in crisis. Stay tuned for more change to come in portfolios as we assess the consequence of tariffs, especially reciprocal tariffs, being put into place!

If you have questions, it is important that you reach out to your advisor.  We recommend stepping back to remember your investment goals and ask yourself if those have changed. Remember, when we are doing your planning work, we expect times like this to occur, "when, why, and how much" are the surprise but not the "if."  Our planning work knows this volatility occurs and builds cushion into your plan to be able to help manage periods like this.

Angela Palacios, CFP®, AIF®, is a partner and Director of Investments at Center for Financial Planning, Inc.® She chairs The Center Investment Committee and pens a quarterly Investment Commentary.

Nicholas Boguth, CFA®, CFP® is a Senior Portfolio Manager and Associate Financial Planner at Center for Financial Planning, Inc.® He performs investment research and assists with the management of client portfolios.

Any opinions are those of the Angela Palacios, CFP®, AIF® and Nick Boguth, CFA®, CFP® and not necessarily those of Raymond James. The information contained in this report does not purport to be a complete description of the securities, markets, or developments referred to in this material. There is no assurance any of the trends mentioned will continue or forecasts will occur. The information has been obtained from sources considered to be reliable, but Raymond James does not guarantee that the foregoing material is accurate or complete. Any information is not a complete summary or statement of all available data necessary for making an investment decision and does not constitute a recommendation. Investing involves risk and you may incur a profit or loss regardless of strategy selected. The S&P 500 is an unmanaged index of 500 widely held stocks that is generally considered representative of the U.S. stock market. The Russell 2000 Index measures the performance of the 2,000 smallest companies in the Russell 3000 Index, which represent approximately 8% of the total market capitalization of the Russell 3000 Index. The MSCI EAFE (Europe, Australasia, and Far East) is a free float-adjusted market capitalization index that is designed to measure developed market equity performance, excluding the United States & Canada. The EAFE consists of the country indices of 22 developed nations. The Bloomberg Barclays US Aggregate Bond Index is a broad-based flagship benchmark that measures the investment grade, US dollar-denominated, fixed-rate taxable bond market. Keep in mind that individuals cannot invest directly in any index, and index performance does not include transaction costs or other fees, which will affect actual investment performance. Individual investor's results will vary. Investing in oil involves special risks, including the potential adverse effects of state and federal regulation and may not be suitable for all investors. Past performance does not guarantee future results. Diversification and asset allocation do not ensure a profit or protect against a loss. Investing involves risk and you may incur a profit or loss regardless of strategy selected. Past performance is not a guarantee or a predictor of future results. Raymond James and its advisors do not offer tax or legal advice. You should discuss any tax or legal matters with the appropriate professional.

The Magnificent Seven are a group of companies including Alphabet, Amazon, Apple, Meta Platforms, Microsoft, NVIDIA, and Tesla. Raymond James makes a market in these stocks. This is not a recommendation to purchase or sell the stocks of the companies mentioned.

What to Expect Every Day in the Stock Market

Print Friendly and PDF

I’ve written about expectations before, but I wanted to revisit the topic after a volatile day in the stock market this past January.

There was a headline that shook up the tech space, and when you opened a financial news website or turned on your TV – the headlines and reactions made it seem like we were entering the next financial crisis. I checked the markets to see what the damage was, and to my surprise, the S&P 500 was only down -1.46%! Sure, some stocks were down big, but the overall market was mixed. The Dow Jones Industrial Average was actually positive on the day, most bonds were positive, and international stocks were only down slightly. It was a volatile day in the markets, but nothing like the media was portraying.

It reminds me of the quote, “Happiness = expectations minus reality.” We often cannot change reality, but we CAN make sure we have realistic expectations. So, what expectations SHOULD we have for daily stock market moves?

Here’s some historical data on the S&P 500 for the past 40 years.

  • Worse than a -1% day: 1191 times, ~30 times per year, or ~2-3 times per month.

  • Worse than a -2% day: 350 times, ~9 times per year, ~2-3 times per quarter.

  • Better than a +1% day: 1350 times, ~34 times per year, or ~3 times per month.

  • Better than a +2% day: 306 times, ~8 times per year, or ~2 times per quarter.

So when the media talked about a -1.46% day like the world was ending, I found some relief in the data and the ability to say, “This might be big news, but a market move like this happens a couple of times per month.” It isn’t consistent, as you can see from the second chart. Some years give us more large down days than others, but that is part of the risk we accept when investing in the stock market. No risk, no reward!

There is noise coming at us all the time, which can make it hard to stay committed to our financial plan. The louder the noise, the more we might be pressured to do something-anything! But in an ideal world, our portfolio and financial plan are set up with the proper expectations so that we see right through the noise and can return to enjoying our life knowing that our financial plan is still on track. Please contact any of us at The Center if you have any questions about your investments or overall financial plan.

Nicholas Boguth, CFA®, CFP® is a Senior Portfolio Manager and Associate Financial Planner at Center for Financial Planning, Inc.® He performs investment research and assists with the management of client portfolios.

The foregoing information has been obtained from sources considered to be reliable, but we do not guarantee that it is accurate or complete, it is not a statement of all available data necessary for making an investment decision, and it does not constitute a recommendation. Investing involves risk and you may incur a profit or loss regardless of strategy selected. Diversification and asset allocation does not ensure a profit or protect against a loss.

The S&P 500 is an unmanaged index of 500 widely held stocks that is generally considered representative of the U.S. stock market. Inclusion of indexes is for illustrative purposes only. Keep in mind that individuals cannot invest directly in any index, and index performance does not include transactions costs or other fees, which will affect actual investment performance.

Any opinions are those of Nicholas Boguth, CFA®, CFP® and not necessarily those of Raymond James.

Past Performance Is No Guarantee of Future Results!

Print Friendly and PDF

Over the past year, the S&P 500 has had a fantastic run and was up 38% (10/31/23 to 10/31/24). Does that mean we should expect lower returns in the next 12 months? Absolutely not, at least not for that reason.

Many investors get nervous after a very positive year. You may hear things like: 

  • “Stocks have been on a great run, so there is no way this can continue.”

  • “Trees don’t grow to the sky!”

  • “The past year was well above average; we’d expect mean reversion and lower returns going forward.”

But the truth is, the next year of stock returns has almost nothing to do with the previous year. The chart above shows the last 12 months’ return on the horizontal axis and the next 12 months’ return on the vertical axis. This is monthly U.S. large stock data since 1934 (90 years of data – over 1000 monthly readings!). If higher return years were generally followed by lower return years, you’d see the dots above in a tighter, more downward-sloping line. This is not a tight downward sloping line. This looks like my toddler got excited with a blue marker.

Statisticians call this a “random walk,” but practically speaking, all it means is that negative years can happen no matter what happened last year, and positive years can happen no matter what happened last year!  Past performance is no guarantee of future results. On average, though, we know that the stock market goes up more than it goes down, diversification is key to smooth out the ride, and a well-designed financial plan is the foundation of it all. Please contact any of us here at the Center if you have questions about any aspect of your financial plan. 

Nicholas Boguth, CFA®, CFP® is a Senior Portfolio Manager and Associate Financial Planner at Center for Financial Planning, Inc.® He performs investment research and assists with the management of client portfolios.

The foregoing information has been obtained from sources considered to be reliable, but we do not guarantee that it is accurate or complete, it is not a statement of all available data necessary for making an investment decision, and it does not constitute a recommendation. Investing involves risk and you may incur a profit or loss regardless of strategy selected. Diversification and asset allocation does not ensure a profit or protect against a loss.

The S&P 500 is an unmanaged index of 500 widely held stocks that is generally considered representative of the U.S. stock market. Inclusion of indexes is for illustrative purposes only. Keep in mind that individuals cannot invest directly in any index, and index performance does not include transactions costs or other fees, which will affect actual investment performance.

Any opinions are those of Nicholas Boguth, CFA®, CFP® and not necessarily those of Raymond James.

Q4 2024 Investment Commentary

Click the image above to watch the video commentary!

Print Friendly and PDF

Think back to one year ago. It's January 2024. So far, the economy had avoided the recession everyone thought was coming. The S&P 500 just wrapped up a +26% year. Bonds provided some positive performance. Inflation was coming down, unemployment was still at historic lows, and the mood could be described as cautious optimism as investors expected a "growing but slowing" economy.

Most market forecasts (more on these later) expected 2024 to be good but definitely not great. ESPECIALLY in an election year, because you never know what sort of uncertainty that could bring!

Well, we just wrapped up 2024. How was it? From the lens of the financial markets, it was a strong year.

Stocks continued to climb, and bonds were slightly positive despite some bond market volatility. The S&P 500 was the standout among the major asset classes, but even small cap stocks and international stocks contributed positive performance.

Q4 brought some volatility and uncertainty between a major presidential election and multiple Fed rate cuts. U.S. stock indices climbed through the uncertainty, but international stocks and bonds fell slightly.

The big change during Q4 was the increase in bond yields as investors adjusted to what is looking like an even stronger economy than expected. A stronger economy generally comes with higher bond yields, which means less rate cuts from the Fed. This was reiterated in the Fed's Summary of Economic Projections in December that showed they expected the Fed Funds Rate to get to 3.9% by the end of 2025 (3 months prior, that projection showed an estimate of 3.4%).

We'll be watching this dynamic continue to evolve in the markets this year, but as of today investors are looking at a strong economy backed by an easing Federal Reserve, positive expectations for stock earnings, and decent bond yields providing strong fixed income options.

Interest Rates and The Economy

In December, the Federal Reserve (the Fed) held its final meeting of 2024, finalizing a year marked by significant continued disinflation and one of the strongest in recent years of economic activity. However, uncertainty always remains when looking ahead. Tariff and immigration policies proposed by the incoming administration are clouding investor's (and the Fed's) outlook for 2025.

With the Fed still in easing mode, equities should continue to be well supported (remember the old saying, "Don't fight the Fed"). While the Fed's December rate cut was a 'hawkish' cut (a cut with guidance there will be fewer future cuts), we continue to focus not on the number of cuts but more on the overall economic trajectory, which seems to be very resilient right now. With the economy still showing momentum, earnings should maintain their climb in 2025—reinforcing our positive longer-term outlook. However, in the short term, there can always be volatility, and after such a strong year, a little short-term volatility would not be unexpected.

So why doesn't this potential increased volatility scare us very much? A strong consumer!  Since the consumer makes up 70% of the U.S. Economy, we are a key ingredient to keep an eye on. The strength of the consumer in 2024 was evident through several key indicators. Consumer spending has shown consistent growth, while consumer confidence remains unshaken, driven by low unemployment rates, steady job growth, and rising wages. There could be some cracks on the horizon for consumer spending. We are starting to see consumers "trade down" a bit in their purchases, meaning they are still happy to spend but on cheaper options for goods and services. There aren't so many cracks to be concerned about yet, but it is certainly an area we watch closely.

Bonds have had a bizarre year. Coming into 2024, we weren't sure what to expect other than the unexpected. As such, the caution we have exhibited in that portion of our portfolios has helped reduce some volatility in bonds in 2024. Treasury yields have moved contrary to normal historical patterns by rising instead of falling after the Fed started to cut rates in the fall. Better-than-expected economic data and inflation not falling as fast as the market would like to see have challenged investors to reassess the Fed's expected rate path. This means yields are likely to stay a bit more elevated than everyone originally thought. If you look at inflation and employment, the Fed has largely accomplished what it set out to do, even though markets might like to see them do more. The chart below shows where we are versus the Fed's targets.

S&P 500 Price Targets and Return Expectations

Major banks and brokerage firms put out S&P 500 price targets every year, and it may or may not surprise you, but they are rarely accurate. It is impossible to predict something as volatile as the stock market over such a short time. Last year, for example, analysts ranged from bearish to bullish, and the stock market blew straight through every one of their price targets by May.

Stock performance over one year can vary dramatically, but it has been remarkably consistent over the long term.

The other thing on investors' minds right now is…can the performance continue? Of course it can! No one knows for sure if it WILL over the next year (as I said, it is impossible to predict something so volatile as the stock market over such a short time frame), but just because stocks had a tremendous last year does not mean that they must lag the following year. In fact, the statistics show there is essentially no correlation between last year's performance and the next year's performance.

Election Outcome and Markets

As the election dust settles, it is important to remember that the economy is usually the guiding force behind winners and losers in our portfolio.  Overall, rising corporate profits, continued economic expansion, and the potential for lower yields later this year provide a potentially positive backdrop for the markets, in our view.  Some areas, like international investments, may see additional headwinds from political forces like tariffs or a strong U.S. dollar.  At the same time, smaller companies in the U.S. may see some natural tailwinds from continued onshoring and disinflation. While there are many reasons for an optimistic outlook, being prepared for a downturn is evergreen. Our actions in your portfolio will reflect our continued research and developments in these areas as President Trump takes office. There are important things that we need to focus on, as always, such as making sure that you have 6-12 months of expenses set aside in cash so that we can weather any short-term volatility in markets (especially if you are retired), rebalancing to maintain proper diversification and paying close attention to tax loss harvesting and capital gains. 

A new administration may provide new risks, but when aren't there risks in investing? With new risks also come new opportunities, and our investment committee meets monthly to ensure portfolios are allocated to take advantage of constantly changing markets. Most importantly, your financial planner here at The Center is here to help you build a financial plan that gives you confidence no matter the market conditions. With that being said, onto 2025!

Angela Palacios, CFP®, AIF®, is a partner and Director of Investments at Center for Financial Planning, Inc.® She chairs The Center Investment Committee and pens a quarterly Investment Commentary.

Nicholas Boguth, CFA®, CFP® is a Senior Portfolio Manager and Associate Financial Planner at Center for Financial Planning, Inc.® He performs investment research and assists with the management of client portfolios.

Any opinions are those of the Angela Palacios, CFP®, AIF® and Nick Boguth, CFA®, CFP® and not necessarily those of Raymond James. The information contained in this report does not purport to be a complete description of the securities, markets, or developments referred to in this material. There is no assurance any of the trends mentioned will continue or forecasts will occur. The information has been obtained from sources considered to be reliable, but Raymond James does not guarantee that the foregoing material is accurate or complete. Any information is not a complete summary or statement of all available data necessary for making an investment decision and does not constitute a recommendation. Investing involves risk and you may incur a profit or loss regardless of strategy selected. The S&P 500 is an unmanaged index of 500 widely held stocks that is generally considered representative of the U.S. stock market. The Russell 2000 Index measures the performance of the 2,000 smallest companies in the Russell 3000 Index, which represent approximately 8% of the total market capitalization of the Russell 3000 Index. The MSCI EAFE (Europe, Australasia, and Far East) is a free float-adjusted market capitalization index that is designed to measure developed market equity performance, excluding the United States & Canada. The EAFE consists of the country indices of 22 developed nations. The Bloomberg Barclays US Aggregate Bond Index is a broad-based flagship benchmark that measures the investment grade, US dollar-denominated, fixed-rate taxable bond market. Keep in mind that individuals cannot invest directly in any index, and index performance does not include transaction costs or other fees, which will affect actual investment performance. Individual investor's results will vary. Investing in oil involves special risks, including the potential adverse effects of state and federal regulation and may not be suitable for all investors. Past performance does not guarantee future results. Diversification and asset allocation do not ensure a profit or protect against a loss. Investing involves risk and you may incur a profit or loss regardless of strategy selected. Past performance is not a guarantee or a predictor of future results. Raymond James and its advisors do not offer tax or legal advice. You should discuss any tax or legal matters with the appropriate professional.

The Fed Just Cut Rates (Again) - Do CDs and Treasuries Still Make Sense?

Mallory Hunt Contributed by: Mallory Hunt

Print Friendly and PDF

The Federal Reserve’s recent decision to continue cutting interest rates has left many investors wondering about their next moves and how to adjust their portfolios. Safe investment options like Certificates of Deposit (CDs) and U.S. Treasuries remain viable options for conservative investors seeking stability and predictable income. As interest rates fluctuate, it’s crucial to assess whether now is a good time to invest in these types of investments or if other options might yield better returns based on you and your investment goals. Here’s why we think these instruments are still worth considering and how you can make the most of them in the current economic climate. Let’s break it down.

Understanding CDs & Treasuries

*A Certificate of Deposit (CD) is a time deposit offered by banks that typically provides a fixed interest rate for a specific term, ranging from a few months to several years. CDs are considered low-risk investments, often insured by the FDIC up to $250,000 per person on the account, making them appealing to conservative investors.

U.S. Treasuries are debt securities issued by the United States Department of the Treasury to finance government spending consisting mainly of Treasury Bills (short-term securities that mature in one year or less), Treasury Notes (medium-term securities that mature in 2 to 10 years) & Treasury Bonds (long-term securities that mature in 20-30 years). They are considered one of the safest investments because they are backed by the full faith and credit of the U.S. Government.

Why CDs Are Still a Good Investment

Despite the rate cuts, CDs continue to offer several benefits for conservative investors:

  1. Safety and Predictability: CDs provide defined income over a fixed term. If you’re risk-averse or looking to preserve capital, CDs can be a stable option, even in a lower-rate environment.

  2. No Market Volatility: Unlike stocks or bonds, CDs are not subject to market fluctuations, making them a reliable choice for those who prefer to avoid risk.

  3. Potential for Laddering: With a lower interest rate environment, you might consider a CD ladder strategy, where you stagger the maturity dates of multiple CDs. This allows you to take advantage of potential future rate changes while still securing some cash in safe, interest-bearing accounts.

As with any investment, what may be suitable for one investor might not be ideal for another. CDs do come with their own set of limitations such as potential liquidity constraints (tying up your funds for a predetermined period) or risks related to reinvestment and interest rates. It is crucial to be thoroughly informed on both the advantages and disadvantages of any investment before making a commitment.

The Appeal of U.S. Treasuries

U.S. Treasuries are another safe haven for investors, especially during periods of economic uncertainty:

  1. Government-Backed Security: Treasuries are backed by the full faith and credit of the U.S. government, making them one of the safest investments available.

  2. Variety of Options: Treasuries come in various maturities, from short-term bills to long-term bonds, allowing you to tailor your investments to your financial goals.

  3. Interest Rate Sensitivity: While treasuries’ yields may decrease following a rate cut, they often perform well during economic downturns as investors seek safe assets.

While the recent rate cuts may have reduced the yields on CDs and Treasuries on the front end of the curve, these instruments still offer valuable benefits for conservative investors. In fact, yields on CDs & Treasuries with longer maturities have actually INCREASED since The Fed began their rate cutting cycle. By employing strategies like laddering and diversification, you can navigate the changing interest rate environment and continue to achieve your financial goals. Keep an eye on economic indicators and remain flexible; the investment landscape can change quickly, and adapting your approach can lead to better outcomes. As always, consult with a financial advisor to tailor your investment strategy to your unique situation. Whether you choose CDs, Treasuries, or explore other avenues, making informed decisions is key to achieving your financial goals.

Mallory Hunt is a Portfolio Administrator at Center for Financial Planning, Inc.® She holds her Series 7, 63 and 65 Securities Licenses along with her Life, Accident & Health and Variable Annuities licenses.

This market commentary is provided for information purposes only and is not a complete description of the securities, markets, or developments referred to in this material. Any opinions are those of the author and not necessarily those of Raymond James. There is no guarantee that these statements, opinions or forecasts provided herein will prove to be correct. Investing involves risk and you may incur a profit or loss regardless of strategy selected. Past performance does not guarantee future results. Diversification and asset allocation do not ensure a profit or protect against a loss.

*Raymond James Financial Services, Inc., is a broker-dealer, is not a bank, and is not an FDIC member. All references to FDIC insurance coverage in relation to Brokered CDs and/or Market-Linked CDs address FDIC insurance coverage, up to applicable limits, at the insured depository institution that is disclosed in the offering documents. FDIC insurance only covers the failure of FDIC-insured depository institutions, not Raymond James Financial Services, Inc. Certain conditions must be satisfied for pass-through FDIC insurance coverage to apply.

Yield Curve and Forward Returns

Print Friendly and PDF

In 2022, there were fear-inspiring articles about the yield curve inversion. Two years later, we’re seeing the same kind of articles about the yield curve UN-inversion! It can’t be both…can it?

Let’s look back at the last 50 years of inversions and un-inversions and see if either has been a consistent signal for the stock market*.

*Source: Morningstar Direct. Performance = S&P 500 TR.

*Source: Morningstar Direct. Performance = S&P 500 TR.

Do those results surprise you? On average, returns look BETTER after inversions AND un-inversions. That headline doesn’t grab as much attention as one that provokes fear, though.

It is hard to filter out the noise when it is so prevalent in our daily lives. We listen to the noise but rely heavily on the data when making decisions in our investment process. If you have questions about your portfolio, please don’t hesitate to reach out.

Nicholas Boguth, CFA®, CFP® is a Senior Portfolio Manager and Associate Financial Planner at Center for Financial Planning, Inc.® He performs investment research and assists with the management of client portfolios.

Securities offered through Raymond James Financial Services, Inc., member FINRA/SIPC. Investment advisory services are offered through Center for Financial Planning, Inc. Center for Financial Planning, Inc. is not a registered broker/dealer and is independent of Raymond James Financial Services.

The information contained in this email does not purport to be a complete description of the securities, markets, or developments referred to in this material. The information has been obtained from sources considered to be reliable, but we do not guarantee that the foregoing material is accurate or complete. Expressions of opinion are as of this date and are subject to change without notice. There is no guarantee that these statements, opinions or forecasts provided herein will prove to be correct. Investing involves risk and you may incur a profit or loss regardless of strategy selected.

Any opinions are those of Center for Financial Planning and not necessarily those of Raymond James.

The S&P 500 is an unmanaged index of 500 widely held stocks that is generally considered representative of the U.S. stock market. Keep in mind that individuals cannot invest directly in any index, and index performance does not include transaction costs or other fees, which will affect actual investment performance. Individual investor's results will vary.

Q3 2024 Investment Commentary

Print Friendly and PDF

This year has been off to a solid start as the melt-up continues. Even during what is usually the worst performing month on average, September, markets rallied. Mega-cap US tech stocks have remained a standout this year again and have driven much of the returns for the S&P 500 for the first half of the year. But, since then, we have seen participation from other areas of the market, such as international, particularly emerging markets, and small company stocks that have made a strong showing since interest rate cuts were back on the table and inflation continued to abate. Bonds have been positive by about the interest they have paid this year, and the Federal Reserve has started to cut interest rates with a .5% cut in September. Interest rate expectations and inflation news have been the major drivers of market returns so far this year. You may have noticed that I have left the election out of this list because the election hasn’t really driven market volatility so far. If you want to learn more about the relationship between elections and markets, check out a replay of our webinar from last month!

As we approach election day, the headlines could potentially drive some short-term volatility and, certainly, our emotions, but historically, long-term markets are driven far more by factors like economic growth, Federal Reserve direction, and fundamentals like growth and valuation. It is very likely that the outcome of the election won’t be settled by the time we wake up the next day, so this could possibly cause some short-term volatility, but we wouldn’t expect this to be sustained. A last note on politics: it is worth mentioning that Congress averted a government shutdown through the passage of a stopgap bill to fund the government through December 20. At that time, we could possibly see some political posturing surrounding this topic again, so we expect to see more headlines surrounding this late in the year. Markets tend to shrug off these headlines as we have “been there, done that” many times before.

GDP

Since the economy is a bigger driver of long-term returns, we should check in on this. As you can see from the chart below, the Federal Reserve seems to be engineering this soft landing they were hoping for.  Inflation and wages continue to come down, unemployment has grown slowly this year, retail sales have slowed a bit, and GDP shows a slowing in this chart but has since had somewhat stronger readings as the year has gone on.

Sources: Bloomberg, Bureau of Economic Analysis, Bureau of Labor Statistics.  Data as of 29 March 2024 for GDP and 31 May 2024 for other statistics.  Retail sails = adjusted retail and food services sales.  Wages = average hourly earnings.

Interestingly, Economic data is almost always revised after the fact. Data points such as how many people in an entire country are looking for jobs, how much money every citizen in a country has earned/spent/saved, or how much the prices of everything in a country have changed – these are pretty hard to track. This quarter, the Bureau of Economic Analysis revised GDP upwards by .3% in 2021, .6% in 2022, and .1% in 2023. Turns out we (consumers) spent more money than previously calculated in the past few years. Remember when we had two negative quarters of GDP growth in early 2022 (which is the technical definition of a recession), but a recession was never declared? Now, with revisions, there weren't actually two negative quarters of GDP growth. The 2nd quarter of 2022 was revised into positive growth rather than negative growth.

Headlines and Inflation

Inflation is still under the microscope despite the Fed shifting gears from the past couple of years' rate-hike environment into the rate-cut environment it has established going forward. The market will likely be watching economic data as it rolls in and reacting accordingly, as it weighs the odds of increasing inflation (and the potential reaction of the Fed moving slower with its rate cuts) OR continued disinflation/deflation (and the potential reaction of the Fed moving faster with its rate cuts). Recently, there have been some headlines of OPEC increasing oil production, which could possibly put downward pressure on oil prices. At the same time, strikes are beginning at ports on the East Coast, which could potentially slow down supply chains and put upward pressure on prices.

Yield Curve UN-Inversion

About two and a half years ago, the yield curve inverted. You can see this in the chart below, with the blue line dropping below 0 (meaning short-term rates are yielding greater than long-term rates).  We wrote about it then and shared that despite the warning sign – stocks still were positive a majority of the time 1 and 2 years later. 2022 was a rough year for both the stock and bond markets, but here we are 2.5 years later, and the S&P 500 is back, making new all-time highs.

Source: https://fred.stlouisfed.org/series/T10Y2Y

Last month, the yield curve UN-inverted (see that blue line above moving back above 0). You may have seen news articles directing attention to THAT event as the event that typically precedes recessions. It is hard to focus on the signal over the noise when the noise is so loud in our daily lives, from 24/7 media coverage to daily newspapers and endless social media feeds, but looking back on the last ten times, the yield curve UN-inverted:

  • 8 out of 10 times, the S&P 500 was higher the next year.

  • 10 out of 10 times, the S&P 500 was higher ten years later.

Source: Morningstar Direct. S&P 500 TR (USD)

So, what does this mean for your portfolio?

After this first rate cut by the FED, the yield curve UN-inverted AND it is looking like the FED has successfully engineered a soft landing. History can generally be a useful guide to understand how different assets (beyond just US Large cap) performed in this time period. Typically, you see risk assets doing well for equities, while in fixed income, quality tends to shine. Certain asset classes may have a little more tailwind behind them because of starting valuations and a scenario layered in where we have had high but falling inflation, so while the outcome may rhyme, it probably won't be identical to below.

Emerging Markets

Emerging markets made some noteworthy moves recently. Outside China, India, and Taiwan are experiencing excellent performance driven by monetary policy easing and their technology sectors. However, China has had some significant developments, causing them to play a bit of catchup recently. Chinese leaders announced several monetary policy initiatives that drove their recent equity return spike. First was a 50 basis point (bps) cut to the reserve requirements (the amount of cash that banks must hold in reserve against deposits). Second, they cut existing mortgage loan interest rates by 50bps. Other initiatives were also put into place to kickstart their economy. While the path forward could be bumpy, several factors remain a potential tailwind, such as reasonable valuations and company fundamentals and easing monetary policy.

Small Cap Stock Performance

Small cap stocks have been lagging their large cap counterparts for most of the last decade, but this quarter we saw one of the biggest moves in recent history from the asset class. Early in the quarter, there was a huge divergence, and small cap stocks provided a boost to portfolios. The Russell 2000 index ended the quarter +9.3%, beating out the S&P 500 index that was only up +5.9%. Many attributed the outperformance to the market reacting to a potential lower interest rate environment as it looked more certain that the Fed would be cutting rates, the cheaper starting valuations of the small cap asset class, and the overall higher volatility expected from the smaller and less liquid stocks. Whatever the catalyst was, many investors who have been waiting a long time for small cap outperformance were rewarded this past quarter.

While most of us invest with an eye years or decades into the future, short-term market swings can still trigger strong emotional reactions and sometimes push normally calm investors to become short-term traders rather than long-term investors. A properly allocated portfolio and enough cash to fund short-term needs can help to allay an emotional response that might derail your long-term plan. Is your portfolio appropriately positioned for your situation? As always, we are here to help!

Angela Palacios, CFP®, AIF®, is a partner and Director of Investments at Center for Financial Planning, Inc.® She chairs The Center Investment Committee and pens a quarterly Investment Commentary.

Nicholas Boguth, CFA®, CFP® is a Senior Portfolio Manager and Associate Financial Planner at Center for Financial Planning, Inc.® He performs investment research and assists with the management of client portfolios.

Any opinions are those of the Angela Palacios, CFP®, AIF® and Nick Boguth, CFA®, CFP® and not necessarily those of Raymond James. The information contained in this report does not purport to be a complete description of the securities, markets, or developments referred to in this material. There is no assurance any of the trends mentioned will continue or forecasts will occur. The information has been obtained from sources considered to be reliable, but Raymond James does not guarantee that the foregoing material is accurate or complete. Any information is not a complete summary or statement of all available data necessary for making an investment decision and does not constitute a recommendation. Investing involves risk and you may incur a profit or loss regardless of strategy selected. The S&P 500 is an unmanaged index of 500 widely held stocks that is generally considered representative of the U.S. stock market. The Russell 2000 Index measures the performance of the 2,000 smallest companies in the Russell 3000 Index, which represent approximately 8% of the total market capitalization of the Russell 3000 Index. The MSCI EAFE (Europe, Australasia, and Far East) is a free float-adjusted market capitalization index that is designed to measure developed market equity performance, excluding the United States & Canada. The EAFE consists of the country indices of 22 developed nations. The Bloomberg Barclays US Aggregate Bond Index is a broad-based flagship benchmark that measures the investment grade, US dollar-denominated, fixed-rate taxable bond market. Keep in mind that individuals cannot invest directly in any index, and index performance does not include transaction costs or other fees, which will affect actual investment performance. Individual investor's results will vary. Investing in oil involves special risks, including the potential adverse effects of state and federal regulation and may not be suitable for all investors. Past performance does not guarantee future results. Diversification and asset allocation do not ensure a profit or protect against a loss. Investing involves risk and you may incur a profit or loss regardless of strategy selected. Past performance is not a guarantee or a predictor of future results. Raymond James and its advisors do not offer tax or legal advice. You should discuss any tax or legal matters with the appropriate professional.