Contributed by: Center Investment Department

As the summer and midterm election season heats up, markets have cooled but ended the quarter on a very positive note after a bumpy start to the year that was caused by the U.S./Iran conflict. From excitement surrounding the SpaceX IPO to a new Chair of the Federal Reserve being sworn in, there has been no shortage of attention-grabbing headlines! The markets ended positive across the board, while volatility has moderated this quarter with periodic shocks based on geopolitical headlines. The Iran war has lasted longer than anticipated, but the economy here in the U.S. remains on track for solid positive growth when you look at real-time statistics like TSA screenings, credit card spending, restaurant bookings, and retail spending in spite of higher gas prices.
Performance Recap
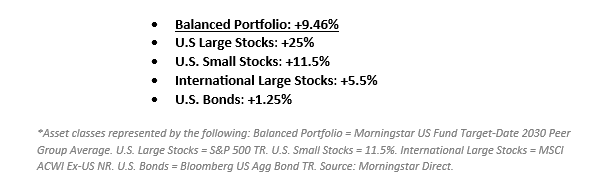
As of June 30, 2026, we have seen quite a turnaround in performance from the first quarter of this year. Bonds posted a positive return of 0.62% during the first half of the year (Bloomberg Barclays Aggregate Bond Index), the S&P 500 ended up 10.21%, and international stocks were the clear winner again so far this year, with the MSCI ACWI Ex-USA at +13.68%. The question remains: what do we see driving returns for the rest of the year?
Elections & Midterms
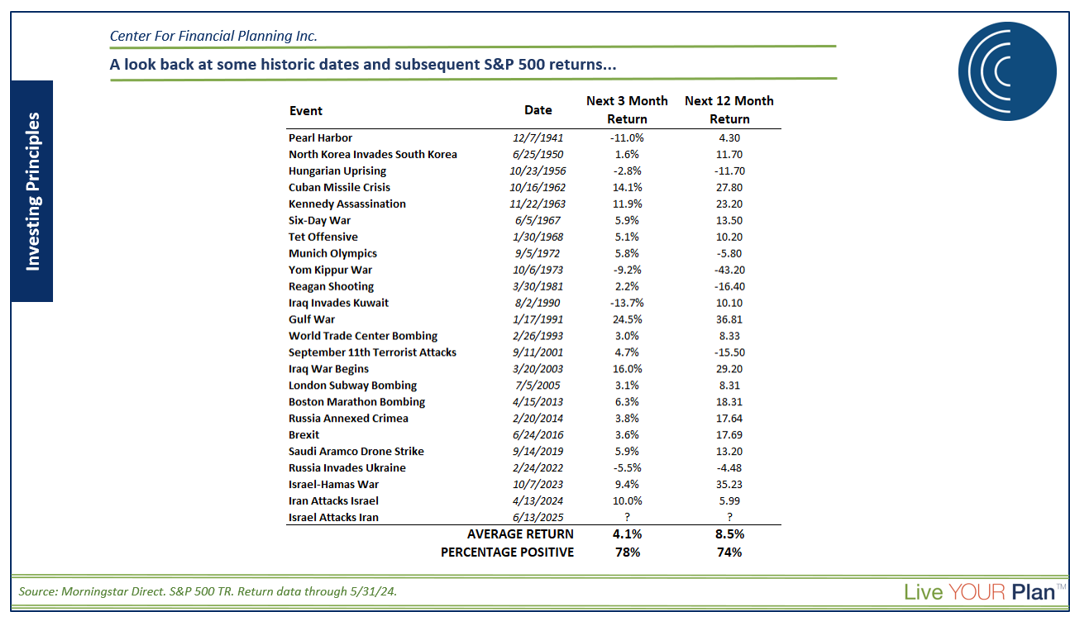
Since Memorial Day, the momentum of positive returns in April and May stalled near market highs. This is not uncommon in a midterm election year. In fact, about half of the time, the S&P 500 has lost money during a midterm election summer, averaging a decline of nearly 3%. This is common because of the political rhetoric leading into election season.
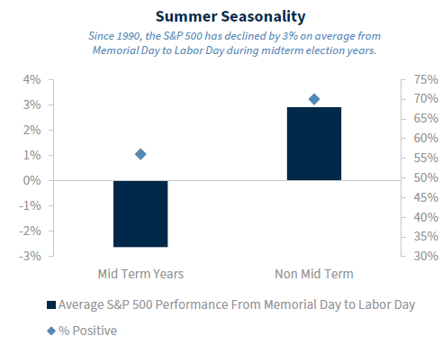
Source: Raymond James, Factset Data as of 5/31/2026 (past performance is not indicative of future results)
Midterm election years have historically been among the more volatile periods in the presidential cycle due to uncertainty around policy, taxes, regulation, and congressional control. Once election outcomes become clearer, markets often refocus on economic fundamentals, and the 12 months following midterm elections have frequently produced stronger returns. History doesn't repeat exactly, but it often rhymes. It is important to stay focused on investing fundamentals during this time:
Stay diversified.
Rebalance when appropriate.
Avoid emotional decisions.
Focus on long-term objectives.
Keep adequate liquidity for near-term needs.
IPOs & SpaceX
We had one of the most highly anticipated and highly media-covered initial public offerings in history this past quarter as SpaceX raised over $75 billion for its operations and growth ambitions.
At $75B, the total market cap of SpaceX was being valued at ~$1.8T, which would put it in the top 10 holdings of the S&P 500 based on size... BUT it will not be added to the S&P 500 anytime soon. Other indexes made exceptions to their rules-based methodologies so that SPCX would be included in their holdings (and in turn held in ETFs that tracked those indexes), and active managers were welcome to begin trading the stock once it became public, but the S&P 500 stuck to its process, which includes criteria that keep SPCX out of the index for the time being. SPCX isn’t currently profitable (it lost $5B in 2025) and also hasn’t been trading for the one-year minimum that S&P uses in its index yet... we’ll check back next year!
Iran, Oil, and Inflation
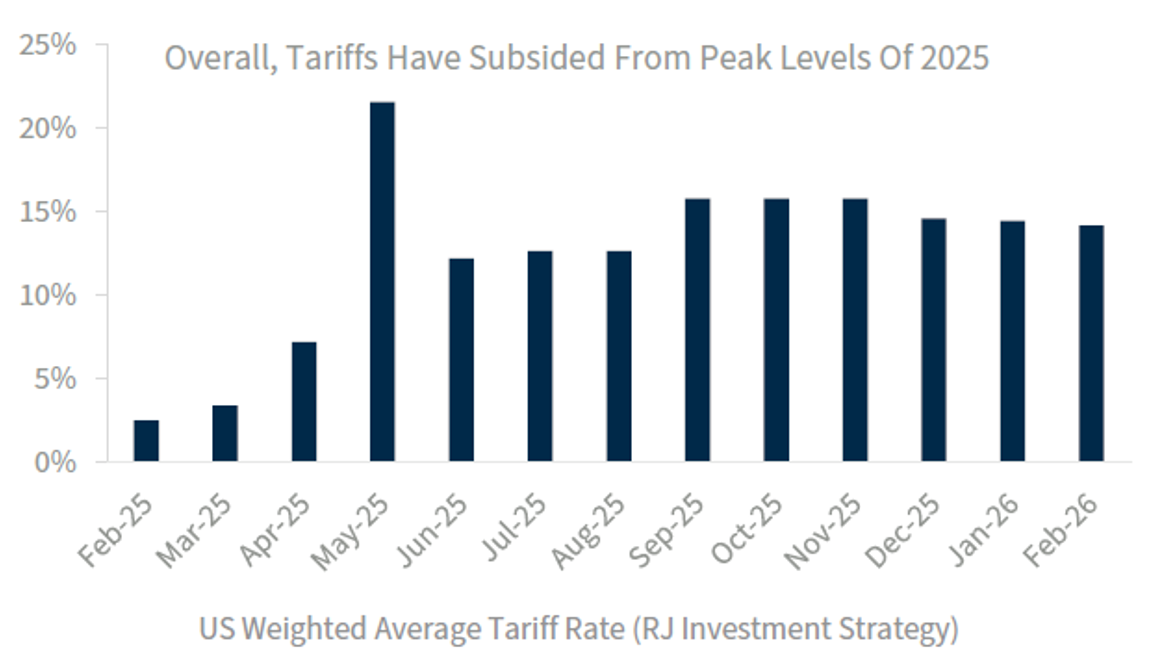
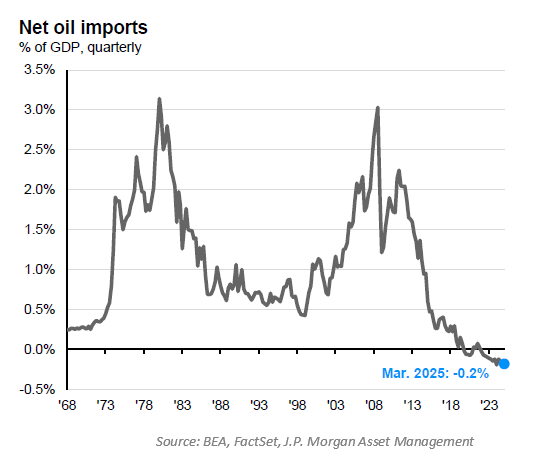
The Iran conflict continued to weigh on markets in Q2. It is a continuation of the geopolitical turmoil that has been affecting markets recently (we spoke about this last quarter as well). It has been a dizzying timeline to follow between attacks, potential ceasefires, more attacks, more ceasefires, blockades, memorandums of understanding followed immediately by more attacks to end the quarter... the story changed by the day. This uncertainty, centered heavily on disruptions in the Strait of Hormuz (a critical chokepoint for ~20% of global oil trade), created meaningful volatility.
Oil prices shot up in March, stayed elevated through most of the quarter, and only just recently began to fade as optimism around Hormuz traffic began to pick back up. Volatility, as measured by the VIX Index, spiked back in March but fell quickly as stocks powered through the flurry of headlines.
To us, this has been yet another reminder to focus on the long term and stick to your investing plan. We cannot predict what the market will bring day to day or month to month, but a disciplined investment process kept us invested through the noise and allowed us to rebalance through the volatility to achieve positive investment outcomes.
The Fed & Kevin Warsh
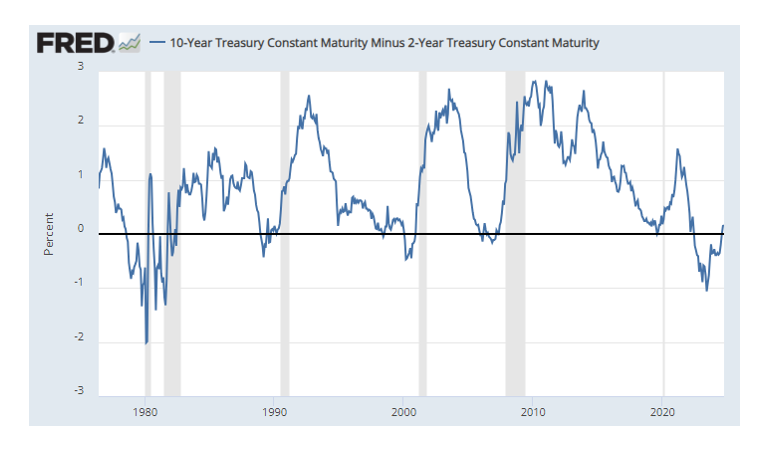
The Fed’s new chair, Kevin Warsh, began his tenure this quarter in a relatively quiet fashion. Just as the market expected leading into the meeting, there were no changes to the federal funds rate or immediate monetary policy. There were some things worth noting from the meeting, such as the fact that Kevin Warsh reiterated that he will not be participating in the “dot plot” projections, and that the rest of the Fed members who did participate mostly shifted their view of inflation and the near-term federal funds rate to remain higher. That feeds into bond market expectations and can have some meaningful impact on our bond allocations. Kevin Warsh also unveiled some new initiatives and task forces that he is implementing at the Fed to restructure its focus and the way it conducts monetary policy going forward.
Values Webinar Recap
In the What Matters Most webinar held in April, Planner & Partner Kali Hassinger, CFP®, CSRIC®, and Portfolio Administrator Mallory Hunt explored the powerful connection between personal values, life goals, and financial decision-making. Rather than focusing solely on investment performance or financial products, the discussion encouraged individuals to begin with what matters most to them—whether that is family, purpose, security, charitable giving, career flexibility, or retirement aspirations—and then build a financial strategy that supports those priorities.
The webinar challenged attendees to think beyond traditional financial goals by identifying the beliefs and values that drive those goals in the first place. Once established, these core values can serve as a financial "North Star," helping individuals stay the course during periods of uncertainty or major life transitions, such as retirement, the loss of a loved one, or a career change. Building a financial plan on a foundation of values provides a consistent framework to return to, allowing decisions to be made with intention rather than emotion during stressful or uncertain times.
At their core, values define the "why," while goals define the "how." From there, financial strategies can be implemented to support both. For example, individuals who prioritize philanthropy may incorporate charitable planning tools such as Donor-Advised Funds (DAFs) or Qualified Charitable Distributions (QCDs) into their overall financial strategy. Values can also influence investment decisions. Environmental, Social, and Governance (ESG) investing, for instance, can be incorporated alongside a core portfolio to help align investment choices with personal beliefs and priorities.
The webinar highlighted how values-based financial planning can create greater clarity, confidence, and intentionality around financial decisions. Practical examples were provided to help individuals identify their core values, align their financial goals with those values, and evaluate financial choices through a more personal and meaningful lens. Ultimately, the overarching message was that a well-designed financial plan is about more than building wealth—it should serve as a tool for aligning financial resources with the life you want to live and the goals that matter most to you.
Thank you for reading this quarter's Investment Commentary. We appreciate the opportunity to share these insights with you. As always, market conditions and personal circumstances can change, but staying focused on your long-term goals remains important. If you have any questions about your investments, financial plan, or any of the topics discussed, our team at The Center is here to help. Please reach out to your advisor to start the conversation. We value your trust and look forward to continuing to serve as a resource for your financial planning needs.
Nicholas Boguth, CFA®, CFP® is a Senior Portfolio Manager and Associate Financial Planner at Center for Financial Planning, Inc.® He performs investment research and assists with the management of client portfolios.
Mallory Hunt is a Portfolio Administrator at Center for Financial Planning, Inc.® She holds her Series 7, 63 and 65 Securities Licenses along with her Life, Accident & Health and Variable Annuities licenses.
Angela Palacios, CFP®, AIF®, is a partner and Director of Investments at Center for Financial Planning, Inc.® She chairs The Center Investment Committee and pens a quarterly Investment Commentary.
Any opinions are those of Angela Palacios, CFP®, AIF®, Nick Boguth, CFA®, CFP®, and Mallory Hunt and not necessarily those of Raymond James. The information contained in this report does not purport to be a complete description of the securities, markets, or developments referred to in this material. There is no assurance any of the trends mentioned will continue or forecasts will occur. The information has been obtained from sources considered to be reliable, but Raymond James does not guarantee that the foregoing material is accurate or complete. Any information is not a complete summary or statement of all available data necessary for making an investment decision and does not constitute a recommendation.
Investing involves risk and you may incur a profit or loss regardless of strategy selected. The S&P 500 is an unmanaged index of 500 widely held stocks that is generally considered representative of the U.S. stock market. The Russell 2000 Index measures the performance of the 2,000 smallest companies in the Russell 3000 Index, which represent approximately 8% of the total market capitalization of the Russell 3000 Index. The MSCI EAFE (Europe, Australasia, and Far East) is a free float-adjusted market capitalization index that is designed to measure developed market equity performance, excluding the United States & Canada. The EAFE consists of the country indices of 22 developed nations. The Bloomberg Barclays US Aggregate Bond Index is a broad-based flagship benchmark that measures the investment grade, US dollar-denominated, fixed-rate taxable bond market. Keep in mind that individuals cannot invest directly in any index, and index performance does not include transaction costs or other fees, which will affect actual investment performance. Individual investors’ results will vary. Investing in oil involves special risks, including the potential adverse effects of state and federal regulation and may not be suitable for all investors. Past performance does not guarantee future results. Diversification and asset allocation do not ensure a profit or protect against a loss. Investing involves risk and you may incur a profit or loss regardless of strategy selected. Past performance is not a guarantee or a predictor of future results. Raymond James and its advisors do not offer tax or legal advice. You should discuss any tax or legal matters with the appropriate professional.