 Contributed by: Center Investment Department

As we close the books on 2021 and move into 2022, we took a few minutes to re-read our thoughts as we started the year. There was a sense of hope that the recovery would continue, jobs would recover, and the world would start to normalize. There was also worry over finalizing the election and concerns of tax rate increases. While it has been a bumpy road, the year has ended better than where we began in some very important aspects like job recovery and dodging the bullet of widely higher taxes. We do have a fresh batch of worries but also optimism looking ahead to 2022.
A diversified benchmark portfolio consisting of 60% stocks (split 40/20 between U.S.-S&P 500 and International-MSCI EAFE) and 40% bonds (Bloomberg Barclays U.S. Aggregate Bond Index) is up just over 12.5% for 2021, with the S&P 500 again leading the way at +28.71%, international stocks (MSCI EAFE) at +11.78%, and U.S. Aggregate Bonds at -1.54%. Please keep in mind indices are not available for direct investment. Any investor who attempts to mimic the performance of an index would incur fees and expenses which would reduce returns.
The good news is, for yet another year, the above hypothetical diversified portfolio would be up well over any targets we may have designed with you toward meeting financial planning goals; which should be an investor’s ultimate long term target.
Should we continue to diversify your portfolio?
Investors everywhere have been left wondering, “Why don’t I just own more U.S. stocks if they are producing such stellar returns this year while everything else (bonds or emerging) has produced very ho hum to negative results?” During these times, it is important to open our history books and remember the “lost decade.”
We are referring to the 10 year time period throughout the 2000’s when the S&P 500 produced a negative total return. This was a very difficult time period starting with the burst of the dot-com bubble and ending with the financial crisis of 2008. Many felt like there was nowhere to hide during this time period. In reality however, those with a widely diversified portfolio had quite the opposite results. Sure a portion of their portfolio was flat to down but many of the other areas of their portfolio performed quite well over this decade, boosting their overall portfolio returns. The chart below illustrates average annual returns from some of the major Morningstar categories from 2000-2009. The lost decade only applied to one type of investment one could own.

Chart and data courtesy John Hancock® Investments
The Center has a long history, being founded in 1985, so we have the benefit of guiding clients through many types of return environments. Coming into this lost decade, investors were asking us the very same questions we are hearing now, and the chart above shows us how that ended. While we don’t believe we are on the doorstep of another lost decade, we do feel it is not the time to abandon diversification. So, when you open your statements this year, you may see other well-known strategies that are roughly 60% Stock/40% bond up even less at just below 10% for the year. So, be careful before making any drastic changes to your portfolio. Talk to your financial planner first to determine how this might impact your long term goals!
What about Inflation?
People are saving less and spending more. Prior to the pandemic the savings rate, according to the Bureau of Economic Analysis, was roughly 7.5%, spiked up to almost 34% at the start of the pandemic in April 2020, and is now back down to 7.5%. With that large savings round trip, however, cash in bank accounts is still very high. Roughly $3.3 trillion of extra cash has accumulated in bank accounts by Americans (source: Longview Economics). All of this extra cash has served as fuel for inflation. As of the end of November, inflation readings hit a 40 year high of 6.8%. Food and energy were the main drivers of these readings. As stimulus slows, we should see spending (demand) in both of these areas level off and even decline a bit.
The Federal Reserve is now taking active measures to try to combat inflation. If you look at the history of interest rates, we have been very low for a long time. The Federal Reserve under chairs, Yellen and Powell, started to creep them back upwards as we emerged from the financial crisis. Then the pandemic struck and The Fed took them right back down near zero. Now the forecast is to start increasing rates again.

The last time we saw inflation at the levels we are at now was back in the early 1980’s. At that time, interest rates were quite high to try to bring inflation down. Sometimes we get the question of why increasing interest rates help to combat inflation. We love this question because it brings us back to the basics of economics!
Inflation is a result of too much money chasing too few goods. Right now, we have both scenarios of this equation playing out. Too much money (remember the paragraph above where we reference how much money households are holding?) chasing too few goods caused by supply chain disruptions. The basic recipe for inflation is in place. You also compound this by the base of comparison; inflation was next to nothing in 2020, teetering on the verge of deflation because no one was spending money. This is called demand-pull inflation for you economics nerds out there. There is also cost-push inflation happening and wages rising for lower income households. This also increases the price of goods and services (higher costs pushing prices higher).
So if low interest rates (cheap borrowing) and government stimulus has put money into our hands to spend and cause inflation, higher interest rates (more expensive borrowing) and no more government handouts should start to take money out of our hands for spending and therefore slowing the rate we buy things. With less demand comes lower prices or at least prices that rise at a slower pace. This is a long and slow process though. These moves by the Federal Reserve do not accomplish the task overnight. Higher interest rates take months to years to filter their way into the economy and slow inflation. Other forces may be present to help curb inflation in the new year as well. Our basis of comparison is going to rise steadily throughout 2022 and supply chain disruptions should start to ease.
Stocks are expensive. Is now a bad time to buy?
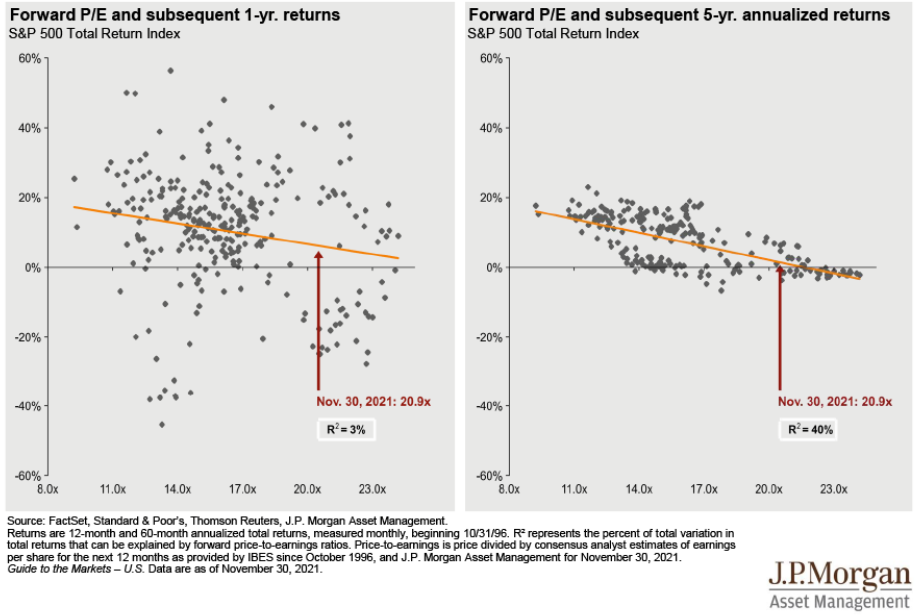
Stocks were expensive at the start of last year too, but if you avoided the S&P 500 last year then you missed out on over 28% of returns. Valuations are not everything when it comes to stock returns, and trying to time the market rarely works in investors’ favor. We are not market timers, but we do monitor the yield curve, leading economic indicators, and various commentary resources for determining our outlook for equities and bonds. Right now, our signals are still saying neutral stocks to bonds. Our research has also found that forward market performance is not correlated highly with P/E ratios.
The below chart shows how uncorrelated valuations are as a short term indicator. Sometimes, with this reading as of November 30th, the market has been up 20-40% (gray dots above the orange line in the left hand chart) one year out and sometimes it has been down 20-30% (gray dots below the orange line in the left hand chart). Five year forward returns were all positive and in most cases positive by more than 5-6%.
International valuations are the opposite story and have been for a long time too, yet they continue to underperform. We continue to hold them as part of the allocation because of the compelling valuation story and importance of diversification. This chart is interesting because it shows how long you can be wrong making an investment call purely on valuation. The ACWI ex-US looked like a good deal versus the U.S. 10 years ago and we know how that story has ended.

The final thing we would like you to remember if you find yourself asking “is now a bad time to buy?” is that if your portfolio is diversified, then large U.S. stocks will only make up a portion of your portfolio. In a diversified 60/40 portfolio for instance, S&P 500 stocks might only make up ¼ of your total portfolio. The other asset classes should provide different return streams or even buffer the portfolio in the event of a U.S. stock market decline. Stick to your plan, rebalance according to it, and avoid making all-in or all-out decisions that could impair your financial future.
Looking forward to 2022
We should start to see interest rates increase and, therefore, we are favoring shorter duration bonds in portfolios for now. We want to continue to let your bonds be bonds and your stocks be stocks. Bonds continue to be an important portion of your portfolio to serve as a volatility dampener while we leave our equities free to generate returns needed to achieve your financial planning goals.
The CDC is relaxing quarantine guidelines as more and more information becomes known about transmutability of the virus. This should serve to start relaxing supply chain disruptions caused by virus spikes hopefully alleviating the transitory portion of inflation. Part of the reason the U.S. performed so strongly in 2021 was a continuation of the re-opening story. We resisted further economic shutdowns despite new waves of Covid outbreaks. Overseas was a different story as outbreaks brought continued sporadic shutdowns. As immunities build and the virus continues to (hopefully) evolve into weaker strains, we should see less of this supporting stronger rallies with overseas markets.
If you are interested in hearing more about our forward-looking views, join us in February for our Economic and Investment Outlook Event. Stay tuned for details in the upcoming weeks.
Remember, we are here to help you meet your investment goals, so feel free to reach out to the investment team or your planner anytime for support. On behalf of the entire Center Team, we wish you a wonderful 2022.
Any opinions are those of the author and not necessarily those of Raymond James. The information contained in this report does not purport to be a complete description of the securities, markets, or developments referred to in this material. There is no assurance any of the trends mentioned will continue or forecasts will occur. The information has been obtained from sources considered to be reliable, but Raymond James does not guarantee that the foregoing material is accurate or complete. Any information is not a complete summary or statement of all available data necessary for making an investment decision and does not constitute a recommendation. Investing involves risk and you may incur a profit or loss regardless of strategy selected. The S&P 500 is an unmanaged index of 500 widely held stocks that is generally considered representative of the U.S. stock market. The MSCI EAFE (Europe, Australasia, and Far East) is a free float-adjusted market capitalization index that is designed to measure developed market equity performance, excluding the United States & Canada. The EAFE consists of the country indices of 22 developed nations. The Bloomberg Barclays US Aggregate Bond Index is a broad-based flagship benchmark that measures the investment grade, US dollar-denominated, fixed-rate taxable bond market. Keep in mind that individuals cannot invest directly in any index, and index performance does not include transaction costs or other fees, which will affect actual investment performance. Individual investor's results will vary. Past performance does not guarantee future results. Diversification and asset allocation do not ensure a profit or protect against a loss. Dividends are not guaranteed and must be authorized by the company's board of directors. Special Purpose Acquisition Companies may not be suitable for all investors. Investors should be familiar with the unique characteristics, risks and return potential of SPACs, including the risk that the acquisition may not occur or that the customer's investment may decline in value even if the acquisition is completed. Investing involves risk and you may incur a profit or loss regardless of strategy selected. Past performance is not a guarantee or a predictor of future results. Raymond James and its advisors do not offer tax or legal advice. You should discuss any tax or legal matters with the appropriate professional.