Investment Markets

A Bond Market Doomsday – Part 2

 With the bond bear potentially rearing its’ ugly head, it is important to understand what a bond bear market looks like to properly prepare a portfolio for it. 

Only one in five investors know how interest rates affect bond prices

In a 2009 study on financial capability, only 21% of respondents knew that prices on existing bonds generally go down when interest rates go up (National Financial Capability Study, 2009 National Survey, Financial Industry Regulatory Authority).   Prices and rates typically move inversely because older bonds with lower rates are less attractive to buyers than newly issued bonds that offer higher rates.

If bond prices have been at all-time lows this stands to reason that bond prices have a long way to fall and indeed they began this fall earlier this year.

When rates go up, prices go down

Take a look at the examples below, illustrating the effect of rising rates on a 5‑year US Treasury bond.
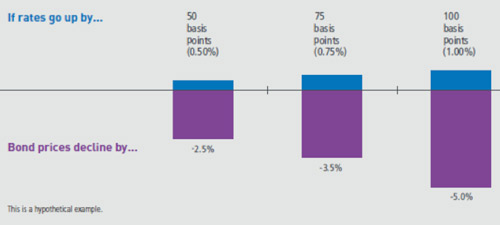
Source: MFS

This is a hypothetical example that represents the effect a rise in the interest rate of a new issue bond may have on the price of existing bond issues.  Although bond prices and interest rates typically move inversely, a change in interest rates is only one factor determining the price of a bond security.

However, what bond bear markets lack in depth, they make up for in length.  In Part 1 I suggested we are in a time similar to the early 1950’s when rates bottomed out at similar levels to where we are today.  Below is a table of returns for the 10 years following rates bottoming taken from the Federal Reserve database in St. Louis. 
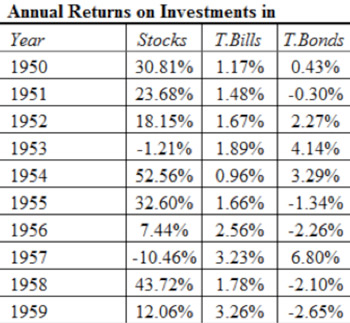
*Stock represented by the S&P 500, Treasury bill rate is a 3-month rate and the Treasury bond is the constant maturity 10-year bond, but the Treasury bond return includes coupon and price appreciation

Rising rates historically means rising income and total returns.  If rates rise slowly, interest has a chance to outweigh loss of principal over time as you can see in the chart above.  Devastating returns are not seen on the bond side of the ledger, but rather slow returns that tend not to keep up with long term inflation rates. 

Diversification rather than Doomsday

While we are not at doom’s doorstep, diversification is certainly the key, as it always is.  Most likely, not all areas of the bond market will suffer at all times over the coming years.  Investors must be careful of certain investments with characteristics similar to that of bonds (i.e. “bond proxies”) though.  Investing in something like dividend paying stocks in place of your bonds could add a lot of potential risk to the portfolio.  These types of positions will not support a portfolio in times of a stock market correction like bonds generally do.  It is important now more than ever to work with your financial planner to make sure you have a well-diversified portfolio and are making decisions with your overall financial goals in mind.

Angela Palacios, CFP®is the Portfolio Manager at Center for Financial Planning, Inc. Angela specializes in Investment and Macro economic research. She is a frequent contributor to Money Centered as well asinvestment updates at The Center.


Diversification does not ensure a profit or guarantee against a loss.  The information contained in this report does not purport to be a complete description of the securities, markets or developments referred to in this material.  The information has been obtained from sources considered to be reliable, but we do not guarantee that the foregoing material is accurate or complete.  The information is not a complete summary or statement of all available data necessary for making an investment decision and does not constitute a recommendation.  Any opinions are those of Center for Financial Planning, Inc., and not necessarily of RJFS or Raymond James.  Expressions of opinion are as of this date and are subject to change without notice.  This information is not intended as a solicitation or an offer to buy or sell any investment referred to herein.  Investments mentioned may not be suitable for all investors.  Investing involves risk and investors may incur a profit or a loss.  Dividends are not guaranteed and must be authorized by the company’s board of directors.  Past performance is not a guarantee of future results.

A Bond Market Doomsday – Part 1

 Eye-catching headlines like this are great ratings boosters right now.  Phrases like “Surviving financial annihilation” or “Devastating losses” have been en vogue lately because investors are becoming more aware that bonds may not be the pillar of our portfolios as we have come to rely on them over the past 30 years.  Yields on bonds have been kept artificially low due to the Federal Reserve’s intervention over the past several years with the Quantitative Easing (QE) programs.  However, now that it looks as though the FED will be backing off of their QE programs, since it looks like the economy will be able to stand on its own two legs, we are left with a bond market with yields at nearly all-time lows

Does this mean that the bond bear is finally out of hibernation? 

The chart below gives us a history lesson on the last time we headed into a bond bear market (early 1950’s).  Rates on the 10-Year U.S. Treasury bond were at similar levels to where they are today.

From what we have seen already this year, it does seem that rates have nowhere to go but up.  According to the above chart, it will be important to temper our return expectations coming from this bond portion of a portfolio.  The average return we have come to expect from bonds will likely be drastically reduced going forward.  If expectations are properly tempered, this need not “annihilate” our portfolios going forward.  In my next blog I will go into more detail of what a bond bear market has looked like in the past.

Angela Palacios, CFP®is the Portfolio Manager at Center for Financial Planning, Inc. Angela specializes in Investment and Macro economic research. She is a frequent contributor to Money Centered as well asinvestment updates at The Center.


The information contained in this report does not purport to be a complete description of the securities, markets or developments referred to in this material.  The information has been obtained from sources considered to be reliable, but we do not guarantee that the foregoing material is accurate or complete. The information is not a complete summary or statement of all available data necessary for making an investment decision and does not constitute a recommendation. Any opinions are those of Center for Financial Planning, Inc., and not necessarily of RJFS or Raymond James. Expressions of opinion are as of this date and are subject to change without notice. There is an inverse relationship between interest rate movements and bond prices. Generally, when interest rates rise, bond prices fall and when interest rates fall, bond prices generally rise.

Black Monday? How about Ruby Tuesday?

 Most investors are familiar with the infamous “Black Monday” stock market crash.   The Dow Jones Industrial Average (DJIA) dropped by a whopping 22.61% in one day on Monday October 19, 1987.  Many may not be as familiar with records that are being set right now for Tuesdays.  May 28th marked the 20th Tuesday in a row where the Dow Jones Industrial Average ended on an up note.  This is a record breaking streak of gains for any specific day of the week in the history of the DJIA.  The previous high count was 13 days in a row and has occurred on 3 separate occasions for Monday, Wednesday and Friday with the most recent streak occurring in 1900! 

This Tuesday winning streak that began on January 15th has included 1,573 points for the Dow or 83% of the years gains for the index as of May 28th.  The picture below is a total of Year to date points made or lost cumulatively on the particular day of the week for the DJIA. 

http://buzz.money.cnn.com/2013/06/04/dow-tuesday-streak/

There has been much speculation as to why Tuesday has been so great? 

Here are some of the arguments.

  • The federal reserve is buying bonds through their open market operations on Tuesday and Friday’s
  • Retail investors placing mutual fund buy orders on Monday, after looking at their accounts over the weekend, and then the managers are putting that money to work on Tuesday.
  • Automated trading programs that seek out trends have noticed this trend and started to buy in anticipation, and as such, perpetuating the trend.
  • Or it could just be random

While the debate of why this phenomenon has occurred may not be over, unfortunately, the winning streak itself is over as of Tuesday June 4th.

http://www.bespokeinvest.com/thinkbig/2013/5/28/20-for-tuesday.html

Angela Palacios, CFP®is the Portfolio Manager at Center for Financial Planning, Inc. Angela specializes in Investment and Macro economic research. She is a frequent contributor to Money Centered as well asinvestment updates at The Center.


The information contained in this report does not purport to be a complete description of the securities, markets, or developments referred to in this material. The information has been obtained from sources considered to be reliable, but we do not guarantee that the foregoing material is accurate or complete. Any information is not a complete summary or statement of all available data necessary for making an investment decision and does not constitute a recommendation. The Dow Jones Industrial Average (DJIA), commonly known as “The Dow” is an index representing 30 stock of companies maintained and reviewed by the editors of the Wall Street Journal. Keep in mind that individuals cannot invest directly in any index, and index performance does not include transaction costs or other fees, which will affect actual investment performance. Individual investor's results will vary. Past performance does not guarantee future results.

Is Your Portfolio Off to the Races?

 We just got to enjoy what has been called “The Greatest Two Minutes in Sports.”  I have always been a fan of the Kentucky Derby, the horses, the outrageous hats, wondering who is wearing the hats, and a blanket of roses.  I’ve had the privilege of actually going down to Louisville to watch but I have never been part of the glamorous, hat-wearing crowd. We’ve always watched from the infield, though “watch” is a loose term. It is more like standing on your tip toes to see a blur of horses run by you for about one-tenth of a second and then return to drinking your mint julep.  But it is fun nonetheless. 

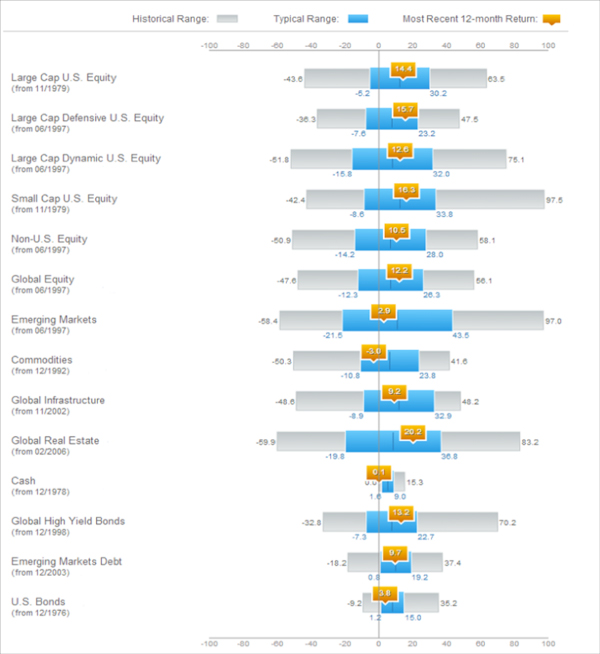
This year the market has felt a lot like we have been off to the races.  It has been one of the strongest starts to the year this decade.  Is it too much too fast?  A new chart put out by Russell Investments says maybe not.


For additional disclosure and interpretive guidance on this chart, please click on the following link: http://www.russell.com/Helping-Advisors/Markets/acd.aspx?d=t 

How to interpret the chart:

  1. The gray bar is the full range of 1 year returns the asset class has experienced throughout history
  2. The blue portion of the bar is where returns fall most of the time (68%)
  3. The number highlighted in orange is where returns fell for the 12 months that ended as of March 31st, 2013

Even with the strong returns, as of recently, most indexes are still hovering near “middle of the road” returns for the past 12 months.  So perhaps it hasn’t been too much too quickly.

If you are seeking some advice on an appropriate strategy for your portfolio, put the odds in your favor and contact your Financial Planner today!

Angela Palacios, CFP®is the Portfolio Manager at Center for Financial Planning, Inc. Angela specializes in Investment and Macro economic research. She is a frequent contributor to Money Centered as well asinvestment updates at The Center.


The information has been obtained from sources considered to be reliable, but we do not guarantee that the foregoing material is accurate or complete.  Links are being provided for information purposes only.  Raymond James is not affiliated with and does not endorse, authorize or sponsor any of the listed websites or their respective sponsors.  Raymond James is not responsible for the content of any website or the collection or use of information regarding any website’s users and/or members.