Presidential Election

Are Democrats or Republicans Better for the Markets?

 Well, since I believe that 96% of statistics are made up, and most political stats are probably the worst offenders, I’m going to stick to the facts. People often ask me, “What is better for the markets, a Democrat or a Republican president?” I wanted to be sure to be as non-partisan a possible and give you just the facts.  If we measure presidential returns since 1900 (where we have meaningful market data) the performance of the markets stacks up like this:  

Looking at the chart above, you see that the Dems have the advantage when it comes to the median.  The best returns came during the administrations of Democrats Bill Clinton and then Franklin Roosevelt. The period from 1913 – 1920 was difficult, but markets in the 1920s were great. The so-called roaring ‘20’s under Calvin Coolidge, a Republican president, was the era when the market boomed on easy money and no bank controls.  Obama's performance, using this yardstick of economic health, has been above average – only slightly below that of Republicans Dwight Eisenhower in the 1950s and Ronald Reagan in the 1980s.

Also, I might add, since Congress holds the purse strings and writes the checks, it might not be the president that we should be measuring.  However, that is what people want to know.  No one has ever asked me what party holding the majority in Congress provides for better stock market returns. The question from people has always been: “What president is better for the market?”

The current sitting president would like this news because strong stock markets usually get presidents reelected.  And the reelection is usually a good indicator of a good stock market going forward, especially if we see a Democrat in the Oval Office and a Republican-controlled Congress, which has been the best combination in politics for market returns. 

Courtesy of Stock trader’s almanac

So this is all very exciting news for Democrats, but consider that any statistician would say we have a few thousand years to go before we have a fair sample set; 17 presidents doesn’t prove much.  With that said, I’m sure that I will be asked this question many more times in my career.


The information contained in this report does not purport to be a complete description of the securities, markets, or developments referred to in this material.  The information has been obtained from sources considered to be reliable, but we do not guarantee that the foregoing material is accurate or complete.  Any opinions are those of Center for Financial Planning, Inc., and not necessarily those of RJFS or Raymond James.  Past performance may not be indicative of future results.  The S&P 500 is an unmanaged index of 500 widely held stocks that is generally considered representative of the U. S. stock market.  Dow Jones Industrial Average (DJIA), commonly known as “The Dow” is an index representing 30 stocks of companies maintained and reviewed by the editors of the Wall Street Journal.  You cannot invest directly in an index.

Elections and the Markets: Landslide victories and divided governments

 While I was only in grade school at the time, many of you may remember the landslide victory of Ronald Reagan in 1984.  He not only won 59% of the popular vote, he also had the highest number of electoral votes (525) over Walter Mondale.  If you were lucky enough to be an investor at this time, you will remember this was the start of a strong bull market run for domestic stocks.  But are landslide victories always this good for investors? 

The short answer is “no,” but there have not been enough landslide victories to get a good sample set to draw conclusions.  The markets don’t necessarily like them because overwhelming victories by either party means the politician could have more power to invoke change and that could mean potentially higher economic policy risk resulting in higher inflation or interest rates on the horizon.

A divided government can alleviate much of this concern as it brings with it the benefits of legislative check and balances.  During Reagan’s era, Democrats controlled the House while Republicans were the majority in the Senate for 6 of his 8 years as President. All parties had to work together to create the successful policies like the 25% across the board tax reduction, deregulation and corporate tax cuts that stimulated the economy and markets onward and upward.

So how does this play out in the 2012 election?  It may feel like the election is close, but consider that the GOP still hasn’t officially nominated a candidate.  Polls tend to favor Obama against presumptive nominee Mitt Romney, but there are still four important months left of campaigning.  It doesn’t appear, at this point in the race, as though a win will be a Reagan-like landslide.  What it will mean for the markets remains as much of a mystery as which candidate will win on November 6th.

Source: FederatedInvestors.com


The information has been obtained from sources considered to be reliable, but we do not guarantee that the foregoing material is accurate or complete.  Any information is not a complete summary or statement of all available data necessary for making an investment decision and does not constitute a recommendation.  Any opinions are those of RJFS or Raymond James.  Past performance may not be indicative of future results.

Elections and the Markets: Better returns on the horizon?

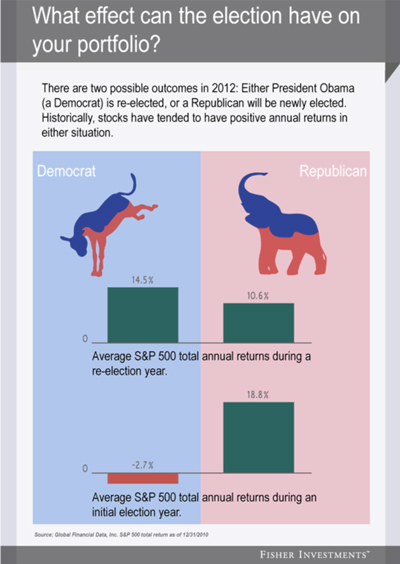
 In 2012, we either re-elect a Democrat or newly elect a Republican—history shows either can be a sweet spot for stocks. Stocks have averaged 14.5% historically in election years a Democrat is re-elected and 18.8% when a Republican is newly elected.

Source: Global Financial Data, Inc. S&P total return as of 12/31/10

When looking at the above returns, it may be hard to believe that we could end up with those kinds of returns by the end of the year … especially with the strong pullback we have seen recently.  In light of this recent pullback in the markets, both domestically and internationally, it is important to revisit a chart we have shared before.  It serves as an important reminder of the volatility experienced each year and the returns that investors end up having the potential to earn despite these pullbacks.

Of course you have no control over the market’s ups and downs or who gets elected, aside from your vote, to serve as the President of the United States, but you can be better prepared to weather these volatile cycles if you focus on factors you can control like staying fully invested.


The S&P 500 is an unmanaged index of 500 widely held stocks that are generally considered representative of the U.S. stock market.  Inclusion of this index is for illustrative purposes only.  Keep in mind that individuals cannot invest directly in any index, and individual investor’s results will vary.  Past performance does not guarantee future results.  The information contained in this report does not purport to be a complete description of the securities, markets, or developments referred to in this material.  Any information is not a complete summary or statement of all available data necessary for making an investment decision and does not constitute a recommendation.  Any opinions are those of Center for Financial Planning, Inc., and not necessarily those of RJFS or Raymond James.

Elections and the Markets: What have you done for me lately?

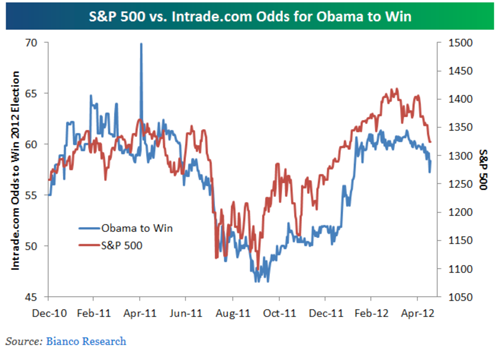
 It’s not just a catchy Janet Jackson song, it’s a question many voters are going to be asking of the President when they head to the polls this November.  One indicator that seems to be more effective than any campaign ad for voters is the stock market. The chart below shows just how highly correlated the odds are that Obama is going to win (based on voter polling from Intrade.com) with the S&P 500.  The higher the S&P come voting time, the more likely he should be to win the election.


In a study done by John Nofsinger, "The Stock Market and Political Cycles," which was published in The Journal of Socio-Economics in 2007, Nofsinger proposed that the stock market may be able to predict which candidate will be elected. He analyzed the relationship between the social mood of the country and the presidential election and concluded that when the country is optimistic about the future, the stock market tends to be high and voters are more likely to vote for those in power. When the social mood is pessimistic, the market is low and people tend to vote out the incumbent and put a new party in power.  

So, while Janet Jackson had relationships in mind rather than elections when she helped write the song, “What Have You Done for Me Lately”, if you can look past those mid-1980’s shoulder pads and frizzy hair, you can find she hits a chord when it comes to how we elect the leaders of our country!


The information contained in this report does not purport to be a complete description of the securities, markets, or developments referred to in this material.  The information has been obtained from sources considered to be reliable, but we do not guarantee that the foregoing material is accurate or complete.  Any information is not a complete summary or statement of all available data necessary for making an investment decision and does not constitute a recommendation.  Any opinions are those of Center for Financial Planning, Inc., and not necessarily those of RJFS or Raymond James.  Past performance may not be indicative of future results.  You cannot invest directly in an index.

Links are being provided for information purposes only.  Raymond James is not affiliated with and does not endorse, authorize or sponsor any of the listed websites or their respective sponsors.  Raymond James is not responsible for the content of any website or the collection or use of information regarding any website’s users and/or members.

Elections and the Market

 It's election season…again!  While the mudslinging between candidates and special interest groups ramps up, how will the stock markets react? 

History suggests that investors can benefit from paying attention to the presidential election cycle.  Yale Hirsch, a stock market historian and the creator of the Stock Trader’s Almanac, has developed the presidential election cycle theory.  This study, among others, supports evidence that there is a significant relationship between the presidential cycle and the stock market.  

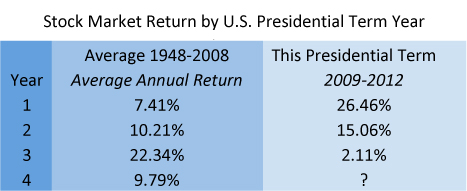
Here is what returns look like on the average election cycle verses our current election cycle:

Source: S&P500 Total Return Index

Year 1: The Post-Election Year
Of the four years in a presidential cycle, the first-year performance of the stock market, on average, is the worst; however, so far with the current administration, it has been the best. We recovered sharply immediately following the financial crisis of 2008.

Year 2: The Midterm Election Year
The second year, although historically better than the first, this time has trailed the strong performance of the first year.

Year 3: The Pre-Presidential Election Year
The third year (the year proceeding the election year) is the strongest on average of the four years, but with the European concerns, ended up being the worst of the cycle so far.

Year 4: The Election Year
In the fourth year of the presidential term and the election year, the stock market's performance tends to be above the overall average.

While the current cycle seems to be turned on its head, it is still worth exploring different election scenarios and how they affect the markets.

  • What if a Democrat wins? What if a Republican wins?
  • What if the race is close? What if it is a landslide?
  • Can the stock market predict an election winner?

While the candidates are busy posturing for the election, we will explore some scenarios and how to posture your portfolio accordingly in the coming weeks.


The S&P 500 is an unmanaged index of 500 widely held stocks that’s generally considered representative of the U.S. stock market.  Keep in mind that individuals cannot invest directly in any index, and individual investor’s results will vary.  Past performance does not guarantee future results.  The information contained in this report does not purport to be a complete description of the securities, markets, or developments referred to in this material.  The information contained in this report does not purport to be a complete description of the securities, markets, or developments referred to in this material.  The information has been obtained from sources considered to be reliable, but we do not guarantee that the foregoing material is accurate or complete.  Any information is not a complete summary or statement of all available data necessary for making an investment decision and does not constitute a recommendation.  Any opinions are those of Center for Financial Planning, Inc., and not necessarily those of RJFS or Raymond James.