Stock Market

CNBC Ratings as a Leading Indicator?

 This may be the most unique candidate for a leading indicator I’ve run across in a long time.  A leading indicator is defined as a measurable economic factor that changes before the economy starts to follow a particular pattern or trend.  You may have heard of an inverted yield curve predicting recessions or the number of building permits applied for predicting a housing boom or bust.

How about CNBC viewership predicting the next stock market boom or bust?  Below is a chart showing Nielson Ratings for CNBC over the last eight years.  The last time their ratings were this low was 2005 when markets had stablized after the tech bubble burst and we had enjoyed a couple of years of good returns.  Sound familiar?

As you can see in the chart below of the S&P 500 total returns, 2005 was the start of some very nice returns which continued for the next few years.  Could the low viewer ratings be a potential indicator that the returns we have experienced since 2009 are just the beginning?  As returns accelerated toward the market peak in 2007 so did CNBC’s ratings into 2007. 

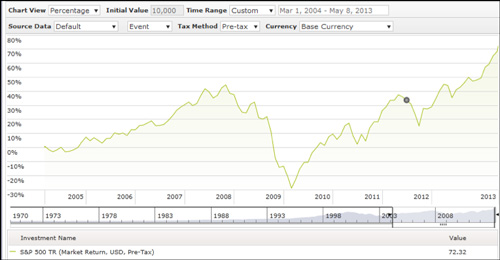
Data from Morningstar

As individual investors start to jump on the band wagon of a bull market run, they become more interested in what is happening to their money and thus turn on the news.

There are many reasons investors could be choosing not to watch the channel now:

  1. Investors have been lulled into a sense of security about market returns and aren’t concerned about current events
  2. Many are not actually invested in the markets; therefore, they do not care
  3. Investors are finding their information elsewhere
  4. They have grown tired of the sensationalizing the network does to try to get better ratings (which is actually my main reason for not watching)

Assuming investors aren’t watching anymore because of one of the first two reasons, then this could be a very good indicator of what is to come, potential positive returns as more individuals put money back to work in the markets.

It is too bad there isn’t much historical data to determine if this is, indeed, a good stock market indicator but it is definitely something from CNBC that is much more interesting to follow than their overly dramatic, TV personalities!

Angela Palacios, CFP® is the Portfolio Manager at Center for Financial Planning, Inc. Angela specializes in Investment and Macro economic research. She is a frequent contributor to Money Centered as well as investment updates at The Center.


Any opinions are those of Center for Financial Planning, Inc., and not necessarily those of RJFS or Raymond James.  Any information is not a complete summary or statement of all available data necessary for making an investment decision and does not constitute a recommendation.  Keep in mind that individuals cannot invest directly in any index, and index performance does not include transaction costs or other fees, which will affect actual investment performance.  Individual investor’s results will vary.  Past performance may not be indicative of future results.

The 3 Missing Bull Market Killers

 Every day I get questions from clients regarding the market being high.  Yes, the market’s nominal price is at an all-time high.  But consider the following situation: Over 20 years, with an average annual gain of 9% per year, the equity market could be looking at a DOW JONES average in the 80,000 range.  Twenty years ago the Dow Jones was hovering around 3,500 and since then we have had a 12 year period when the Dow did not make a new high, but still averaged almost 9% a year.   

The three things that tend to kill a bull market are inflation, interest rates, and valuations, and none of them are present yet.

A Look at Inflation

Notice that we are tracking at one of the lowest rates in history. You’ll see the Consumer price Index is well below the 10-year average. Just compare the difference between the price level of consumer goods and services in 2013 and in early 1980’s:

Sources: Bloomberg and Legg Mason. Past performance is no guarantee of future results. Please note that an investor cannot invest directly in an index, and index performance does not include transaction costs or other fees, which will affect actual investment performance.  Individual investor’s results will vary. The graph above is for illustrative purposes only and is not reflective an actual investment.

I don’t think I would be the first to remind you that interest rates are still at the lowest levels in history. This chart tracks interest rates and inflation as both trended down in recent years.

Interest Rates and Inflation

And when looking at the final potential bull killer, equity valuations, you’ll see the measures are in line with historical averages.  Not expensive and not cheap.

Equity Valuations

History as our guide would tell us that until all three or at least one of the bull market killers are present this bull is still alive and well.

Matthew E. Chope, CFP ® is a Partner and Financial Planner at Center for Financial Planning, Inc. Matt has been quoted in various investment professional newspapers and magazines. He is active in the community and his profession and helps local corporations and nonprofits in the areas of strategic planning and money and business management decisions. In 2012 and 2013, Matt was named to the Five Star Wealth Managers list in Detroit Hour magazine.


Five Star Award is based on advisor being credentialed as an investment advisory representative (IAR), a FINRA registered representative, a CPA or a licensed attorney, including education and professional designations, actively employed in the industry for five years, favorable regulatory and complaint history review, fulfillment of firm review based on internal firm standards, accepting new clients, one- and five-year client retention rates, non-institutional discretionary and/or non-discretionary client assets administered, number of client households served.

The information has been obtained from sources considered to be reliable, but we do not guarantee that the foregoing material is accurate or complete.  Any opinions are those of Center for Financial Planning, Inc., and not necessarily those of RJFS or Raymond James.  The Dow Jones Industrial Average (DJIA) is an index representing 30 stocks of companies maintained and reviewed by the editors of the Wall Street Journal.

The Earnings Upset

 My husband, brother-in-law and friends will never forget one Saturday afternoon spent at “The Big House”.  University of Michigan was playing Toledo and was expected to win by a large margin as they usually did against their regional MAC opponents.  I remember this particular game because they had much-coveted press box seats and sideline passes that my brother-in-law acquired in a charity auction.  They were expecting more excitement from the prestige of visiting the sidelines and sitting in the press box than from the game.  Little did they know what was in store that day.  For the first time ever Michigan lost to a MAC team with a score of 13-10!

The fourth quarter 2012 earnings season started much like the fans’ attitudes for Toledo before this game.  People were dismissing it as a lost quarter and game before it even began.  After Hurricane Sandy and the Fiscal Cliff debacle, many thought earnings would be a bust before they were even reported.  However, a little more than half way through corporate earnings releases, stocks are soaring for the year (at least as of writing this) and earnings are looking half-way decent.

  • Revenue Growth has been solid, up 3.3% so far.  Cost cutting continues to be the name of the game here.  70% of companies that have reported have beaten revenue forecasts, which are above average (66%).
  • Demand from emerging markets has fueled growth at large multinational companies.
  • A Narrowing Trade Deficit for the fourth quarter as reported by the U.S. Commerce Department means we are exporting more and importing less. This keeps more dollars in the U.S. and has also helped boost corporate earnings.

So, while positive earnings are usually the earliest released, it still should be a very decent show for corporate earnings for the end of last year.  Luckily for investors and the University of Toledo critics they now understand, “That’s why we play the game.”  As for my husband and his friends, they did enjoy the excitement of watching kick-off from the sidelines and the free snacks in the press box, if not a Michigan win!

http://www.usatoday.com/story/money/2013/02/06/corporate-profit-investors-earnings/1896885/

Angela Palacios, CFP®is the Portfolio Manager at Center for Financial Planning, Inc. Angela specializes in Investment and Macro economic research. She is a frequent contributor to Money Centered as well asinvestment updates at The Center.


Links are being provided for information purposes only.  Raymond James is not affiliated with and does not endorse, authorize or sponsor any of the listed websites or their respective sponsors.  Raymond James is not responsible for the content of any website or the collection or use of information regarding any website’s users and/or members.  The information contained in this report does not purport to be a complete description of the securities, markets or developments referred to in this material.

The information has been obtained from sources considered to be reliable, but we do not guarantee that the foregoing material is accurate or complete.  Any information is not a complete summary or statement of all available data necessary for making an investment decision and does not constitute a recommendation. Any opinions are those of the authors and not necessarily those of Raymond James.  Investing involves risk and investors may incur a profit or a loss.  Investing in emerging markets can be riskier than investing in well-established foreign markets.  The S&P 500 is an unmanaged index of 500 widely held stocks that is generally considered representative of the U.S. stock market.  Keep in mind that individuals cannot invest directly in any index and index performance does not include transaction costs or other fees, which will affect actual investment performance.  Individual investor’s results will vary.  Past performance does not guarantee future results.

Elections and the Market

 It's election season…again!  While the mudslinging between candidates and special interest groups ramps up, how will the stock markets react? 

History suggests that investors can benefit from paying attention to the presidential election cycle.  Yale Hirsch, a stock market historian and the creator of the Stock Trader’s Almanac, has developed the presidential election cycle theory.  This study, among others, supports evidence that there is a significant relationship between the presidential cycle and the stock market.  

Here is what returns look like on the average election cycle verses our current election cycle:

Source: S&P500 Total Return Index

Year 1: The Post-Election Year
Of the four years in a presidential cycle, the first-year performance of the stock market, on average, is the worst; however, so far with the current administration, it has been the best. We recovered sharply immediately following the financial crisis of 2008.

Year 2: The Midterm Election Year
The second year, although historically better than the first, this time has trailed the strong performance of the first year.

Year 3: The Pre-Presidential Election Year
The third year (the year proceeding the election year) is the strongest on average of the four years, but with the European concerns, ended up being the worst of the cycle so far.

Year 4: The Election Year
In the fourth year of the presidential term and the election year, the stock market's performance tends to be above the overall average.

While the current cycle seems to be turned on its head, it is still worth exploring different election scenarios and how they affect the markets.

  • What if a Democrat wins? What if a Republican wins?
  • What if the race is close? What if it is a landslide?
  • Can the stock market predict an election winner?

While the candidates are busy posturing for the election, we will explore some scenarios and how to posture your portfolio accordingly in the coming weeks.


The S&P 500 is an unmanaged index of 500 widely held stocks that’s generally considered representative of the U.S. stock market.  Keep in mind that individuals cannot invest directly in any index, and individual investor’s results will vary.  Past performance does not guarantee future results.  The information contained in this report does not purport to be a complete description of the securities, markets, or developments referred to in this material.  The information contained in this report does not purport to be a complete description of the securities, markets, or developments referred to in this material.  The information has been obtained from sources considered to be reliable, but we do not guarantee that the foregoing material is accurate or complete.  Any information is not a complete summary or statement of all available data necessary for making an investment decision and does not constitute a recommendation.  Any opinions are those of Center for Financial Planning, Inc., and not necessarily those of RJFS or Raymond James.