Center Investing

Investment Commentary - 1st Quarter 2014

Dear clients and friends,

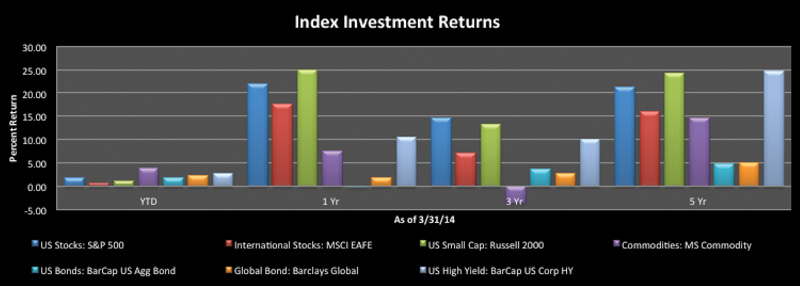
We’re four months into 2014 and so far there is not much to show for when it comes to year-to-date investment returns. Markets have treaded water in 2014 so far. Looking further out to the last 12 months, 3 years or 5 years and most investors in stocks or a diversified portfolio of stocks and bonds have been rewarded for their commitment to investing.

I mention this as we have just passed the five year anniversary of market lows in March 2009. I think it’s a healthy exercise to remember today your state of mind five years ago as an investor. Did you feel it was appropriate to put your faith in investment markets at the time? How do you contrast the stress that you may have felt along with most investors to the feelings related to quite positive stock market returns over the last several years?

The past few weeks marked another milestone as you likely filed taxes. High earners saw the bill from new taxes and rates. While tax burdens have become larger for many, the opportunities to manage taxes are coming to the forefront in the wealth management field. Strategies including asset location, cost basis election, and tax-loss harvesting are employed where appropriate.

If you’re a client of The Center, make sure you send a copy of your 2013 tax return. Information from this is used to evaluate your current tax circumstances and helps us to make more informed decisions on your investments and general financial planning strategies both on a before and after-tax basis.

We’ve done some sprucing up on our investment commentary website. Here are some things to look for this quarter:

  • A tactical asset allocation dashboard is available with our investment committee’s latest weightings. Today we have bonds slightly underweight due to the low interest rate environment and stocks slightly overweight. We’re concerned about valuations for small company stocks in the US and have underweighted these positions. We are finding international equities more attractive due to valuations and have increased our allocations from underweight to neutral in the last six months.

  • We have launched a quarterly investment pulse which gives you some insight to research and conversations with other investment professionals. Angie Palacios’ first edition of this update highlights our thoughts on municipal bonds, stock market valuations, and a manager departure at PIMCO.

  • Investment returns as of the end of the first quarter are available along with Raymond James capital markets review summarizing current economic and investment data.

Whether markets are recently up or down, your commitment to a diligent investment process and focus on overall financial goals is to be commended. Please don’t hesitate to let us know if you have any questions regarding general investment strategies as well as your specific portfolio. Thanks as always for your trust and commitment to the financial planning process.

On behalf of everyone at The Center,

Melissa Joy, CFP®
Partner, Director of Investments
CERTIFIED FINANCIAL PLANNER™

Melissa Joy, CFP®is Partner and Director of Investments at Center for Financial Planning, Inc. In 2013, Melissa was honored by Financial Advisor magazine in the Research All Star List for the third consecutive year. In addition to her contributions to Money Centered blogs, she writes investment updates at The Center and is regularly quoted in national media publications including The Chicago Tribune, Investment News, and Morningstar Advisor.


Financial Advisor magazine's inaugural Research All Star List is based on job function of the person evaluated, fund selections and evaluation process used, study of rejected fund examples, and evaluation of challenges faced in the job and actions taken to overcome those challenges. Evaluations are independently conducted by Financial Advisor Magazine.

The information contained in this report does not purport to be a complete description of the securities, markets, or developments referred to in this material. Any information is not a complete summary or statement of all available data necessary for making an investment decision and does not constitute a recommendation. Any opinions are those of Melissa Joy and not necessarily those of RJFS or Raymond James. Past performance may not be indicative of future results. You should discuss any tax or legal matters with the appropriate professional. Diversification and asset allocation do not ensure a profit or protect against a loss. Investing involves risk and you may incur a profit or loss regardless of strategy selected.

The Investment Pulse: What we’ve heard in the First Quarter

invcom_20140417a.jpg
invcom_20140417b.jpg

At The Center each of us spends a substantial amount of time reading, listening to speakers and attending conferences. The goal is to provide our clients with the best possible advice. Here’s a brief summary of the high points the Investment Department has heard this year so far.

Municipal Bonds

In January, Melissa Joy and Angela Palacios spoke with a Municipal bond specialist from T. Rowe Price. We discussed the current environment and what may affect municipal bonds looking ahead.

  • Distressing news from Detroit and Puerto Rico last year caused retail investors to flee from municipal bonds in general, creating what many believed to be an excellent investment opportunity.

  • This caused unusual cross-over buying which means that investors that typically only invest in taxable bonds were compelled by valuations and yield to purchase tax free bonds for portions of their portfolios. Banks are even utilizing municipal bonds as part of their liquid investment buckets. These are rare events.

  • Tax filing time creates buying opportunities for municipal bond investors as taxes are top of mind in the March/April time frame when checks are being written to pay for taxes due.

Stock Market Valuations

There has been much heated debate as to whether the stock market is over or under valued on the fifth anniversary of the bull market. We attempt to review varying arguments in order to make educated decisions on the allocation of our portfolios. One extreme yet interesting view-point comes from Eric Cinnamond, Portfolio Manager for an Aston/River Road fund. Eric has strict valuation guidelines as to what he will and will not pay for small companies and is willing to hold cash in absence of opportunities.

  • He has more cash than he ever thought he would have, currently 70% of his allocation. He feels valuations are very bloated and that for valuations to continue to expand, the U.S. economy will have to continue running at peak profits with no recession indefinitely (he did state that these valuations can continue for quite some time before correcting).

  • When we get to these points in the market cycle, you start to hear the question, “Is it different this time?” Cinnamond says he is getting this question a lot lately because of his contrarian viewpoint.

  • He will continue to hold cash as dry powder to deploy in the event of a market pull back and stands by his process.

Bond Giant Woes

In mid-January, PIMCO announced that Mohamed El-Erian resigned his role as co-Chief Investment Officer and Chief Executive Officer for PIMCO funds. While he had only an indirect impact on our PIMCO holdings we are continuing to watch further developments at PIMCO. Bill Gross & Rob Arnott remain the key managers to the PIMCO strategies we utilized for clients. While it currently appears Bill Gross is a difficult personality to work with he continues to provide excellent returns compared to the bond market in general.

The information contained in this report does not purport to be a complete description of the securities, markets, or developments referred to in this material. The information has been obtained from sources considered to be reliable, but we do not guarantee that the foregoing material is accurate or complete. Any information is not a complete summary or statement of all available data necessary for making an investment decision and does not constitute a recommendation. Any opinions are those of Angela Palacios and not necessarily those of RJFS or Raymond James. This information is not intended as a solicitation or an offer to buy or sell any security referred to herein. Investments mentioned may not be suitable for all investors. Past performance may not be indicative of future results. Municipal bond interest is not subject to federal income tax but may be subject to AMT, state or local taxes. Income from taxable municipal bonds is subject to federal income taxation; and it may be subject to state and local taxes. Municipal securities typically provide a lower yield than comparably rated taxable investments in consideration of their tax-advantaged status. Investments in municipal securities may not be appropriate for all investors, particularly those who do not stand to benefit from the tax status of the investment. Please consult an income tax professional to assess the impact of holding such securities on your tax liability.

Tactical Asset Allocation Dashboard

The below chart reflects the Center for Financial Planning’s Investment Committee current positioning relative to our longer-term strategic models.

20140417_tactical_asset.jpg
  • Maintain a modest equity overweight as Leading indicators suggest better global growth ahead

  • Expect equities to outperform bonds and cash and fixed income to underperform

  • Continue to favor tactical allocation strategies

  • Underweight U.S. equity allocations given relative valuations and we see potentially better opportunities in select international equities.

Asset Class Definitions

Core Bonds: Securities with primary exposure to bonds with historically low default risk and high correlation to Barclay’s U.S. Aggregate Bond Index.  This includes Investment Grade bonds with Intermediate Maturities.  This index covers the U.S. investment grade fixed rate bond market, with index components for government and corporate securities, mortgage pass-through securities, and asset-backed securities.  These major sectors are subdivided into more specific indexes that are calculated and reported on a regular basis.  Municipal Bonds are also included.

Strategic Income: Securities with primary exposure to bonds with less interest rate risk and types of bonds that are less correlated to the Barclay’s U.S. Aggregate Bond Index.  This covers the universe of fixed-rate, non-investment grade debt (High Yield).  Canadian and global bonds (SEC-registered) of issuers in non-EMG countries are included.

U.S. Large Cap Equity: Securities correlated to the Russell 1000 Index: Based on a combination of their market cap and current index membership, this index consists of approximately 1,000 of the largest securities from the Russell 3000. Representing approximately 92% of the Russell 3000, the index is created to provide a full and unbiased indicator of the large cap segment.

U.S. Small/Mid Cap Equity: Securities correlated to Russell Midcap Index: A subset of the Russell 1000 index, the Russell Midcap index measures the performance of the mid-cap segment of the U.S. equity universe. Based on a combination of their market cap and current index membership, includes approximately 800 of the smallest securities which represents approximately 27% of the total market capitalization of the Russell 1000 companies. The index is created to provide a full and unbiased indicator of the mid-cap segment.  Securities also correlated to the Russell 2000 Index.   The Russell 2000 Index measures the performance of the small-cap segment of the U.S. equity universe. The Russell 2000 is a subset of the Russell 3000 Index representing approximately 10% of the total market capitalization of that index. It includes approximately 2000 of the smallest securities based on a combination of their market cap and current index membership. The Russell 2000 Index is constructed to provide a comprehensive and unbiased small-cap barometer and is completely reconstituted annually to ensure larger stocks do not distort the performance and characteristics of the true small-cap opportunity set.

International Large Cap:  Securities are correlated to the MSCI EAFE.  This index is a free float-adjusted market capitalization index that measures the performance of developed market equities, excluding the U.S. and Canada. It consists of the following 22 developed market country indices: Australia, Austria, Belgium, Denmark, Finland, France, Germany, Greece, Hong Kong, Ireland, Israel, Italy, Japan, the Netherlands, New Zealand, Norway, Portugal, Singapore, Spain, Sweden, Switzerland and the United Kingdom.

International Small/Mid Cap:  Securities are correlated to the MSCI EAFE Small-Cap Index.  This index is an unmanaged, market-weighted index of small companies in developed markets, excluding the U.S. and Canada.

Strategic Equity:  Securities with exposure to alternative investments that are less correlated to stocks and bonds with expectations and investments that can span across asset classes.  Also includes investments in managed futures.

*This material is for informational purposes only and should not be used or construed as a recommendation regarding any security outside of a managed account. Any opinions are those of The Center for Financial Planning and not necessarily those of Raymond James. Expressions of opinion are as of 03/31/2014 and are subject to change. Diversification and asset allocation do not assure a profit or protect against loss. The prices of small company stocks may be subject to more volatility than those of large company stocks. International investing involves additional risks such as currency fluctuations, differing financial and accounting standards, and possible political and economic instability. Investing in emerging markets can be riskier than investing in well-established foreign markets. Investing involves risk and investors may incur a profit or a loss. Bond prices and yields are subject to change based upon market conditions and availability. If bonds are sold prior to maturity, you may receive more or less than your initial investment. There is an inverse relationship between interest rate movements and fixed income prices. Generally, when interest rates rise, fixed income prices fall and when interest rates fall, fixed income prices rise. High-yield bonds are not suitable for all investors. The risk of default may increase due to changes in the issuer's credit quality. Price changes may occur due to changes in interest rates and the liquidity of the bond. When appropriate, these bonds should only comprise a modest portion of a portfolio. Investments in municipal securities may not be appropriate for all investors, particularly those who do not stand to benefit from the tax status of the investment. Municipal bond interest is not subject to federal income tax but may be subject to AMT, state or local taxes. Global bonds tend to be denominated in the currency of the country in which they are issued. Most global bonds have higher default and currency risks than U.S. bond issues. Also, in some cases foreign governments don't allow the purchase of government bonds by non-residents. Managed futures involve specific risks that may be greater than those associated with traditional investments and may be offered only to clients who meet specific suitability requirements, including minimum net worth tests. You should consider the special risks with alternative investments including limited liquidity, tax considerations, incentive fee structures, potentially speculative investment strategies, and different regulatory and reporting requirements. You should only invest in hedge funds, managed futures or other similar strategies if you do not require a liquid investment and can bear the risk of substantial losses. There can be no assurance that any investment will meet its performance objectives or that substantial losses will be avoided. Individuals cannot invest directly in any index. Past performance does not guarantee future results.

Investment Performance - 1st Quarter 2014

invcom_performance_2014q1.jpg

Source: Morningstar

US Bonds represented by Barclay's US Aggregate Bond Index a market-weighted index of US bonds. US stocks per S&P 500 Index a market-cap weighted index of large company stocks. Barclay’s Capital Global Bond index is a market-cap weighted index of global bonds. US Small Companies per Russell 2000 Index a market-cap weighted index of smaller company stocks. International stocks measured by MSCI EAFE is a stock market index designed to measure the equity market performance of developed markets outside of the US and Canada. Commodities per Morgan Stanley Commodity Index a broadly diversified index designed to track commodity futures contracts on physical commodities. Barclays Capital US Corporate High Yield Index is an unmanaged index that covers the universe of fixed-rate, noninvestment-grade debt. Barclays Capital US Corporate High Yield Index is an unmanaged indexthat covers the universe of fixed-rate, noninvestment-grade debt.

Inclusion of these indexes is for illustrative purposes only. Keep in mind that individuals cannot invest directly in any index, and index performance does not include transaction costs or other fees, which will affect actual investment performance. Individual investor’s results will vary. Past performance does not guarantee future results.

Investment Commentary - 4th Quarter 2013

invcom_20131125a.jpg
invcom_20131125b.jpg

What goes up... 2013 has been a year of extremes. The stock market[i] has produced dramatically positive total returns. Meanwhile bonds[ii] are suffering their worst losses in almost 15 years. Whether rate rise result in the advent of a new “rising rate regime” where returns have more and more headwind over time is yet to be determined. Meanwhile, stock returns have been so strong (north than 25% as of November 19th) that market watchers are increasingly debating the sustainability of continued positive returns.

Here are full asset class returns through the 3rd quarter. Of note: we have marked the five-year anniversary of Lehman Brother’s collapse – an infamous period in American market history and also a reminder of how far portfolios and personal balance sheets have come since that time.

Economic Update

The extremity of returns is being accompanied by more unexceptional economic growth. While a desirable recovery growth rate might be 4%, the real gross domestic product was most recently measured at 2.8%[iii]. What growth there is has come without a hiring bonanza that Main Street and the Fed are craving; unemployment continues to get better but at an unimpressive pace. There are, however, quite a few bright spots in the economy.

What are the bright spots?

  • Always a critical factor to economic growth, housing prices are coming off a strong year of recovery with a tight supply and rising demand. Affordability of home ownership still seems to be reasonable due to low borrowing rates for those who can qualify and rising rents. While we don’t think the high pace of recovery can be sustained, we do think the housing picture will continue to look more positive.
  • Corporate profitability continues to be near historic highs. Companies, like households, did a lot of belt-tightening over the last five years. The question today is when will companies start to spend some of their cash war chest they’ve accumulated on capital expenditures or hiring?
  • Surprises have come to the economy through an energy renaissance that is welcomed by US capital markets but reviled by those concerned with environmental impact of shale drilling. An underreported note is that new energy production is accompanied by continued muted demand which may be the result of slower recovery but also changes in behavior through more efficient energy usage. We will continue to keep our eyes on this development for potential positive feedback to housing and US manufacturing.
  • Foreign markets have been less cheers and more jeers for much of the past few years. A recurrence of growth in Europe and introduction of new stimulus in Japan has meant that investors saw better returns[iv] in 2013. We still see attractive valuations relative to US stocks and bonds in some instances.

Valuations Today

Rather than taking a victory lap, investors are asking what’s around the corner and whether the strong returns of 2013 might be leading into a new bubble. Stock market valuations (measures of whether stocks are more or less expensive) seem to be in the fair value range – trading around a price-earnings ratio between fifteen and sixteen times[v]. We agree that what goes up may at some point come down – there has been very little pull-back in the US market this year and at some point, bigger drawdowns are probably likely.

On the plus side, much of the 2013 sequestration may be behind us, depending on the results of Washington DC negotiations on the budget and debt ceiling. Also, many have kept cash on the sidelines waiting for drawbacks to occur so they can buy at lower prices. We think this “cash on the sideline” may be part of the reason drawbacks have been so shallow this year and there is more cash where that came from. When you couple that cash with the huge pile of bonds people have purchased in the past five years with very low prospects for future return, there may be more fuel for the stock market fire.

Portfolio Construction Today

We have continued to underweight core bonds in investment portfolios, overweighting multi-sector bond diversifiers and equities in their stead. While reduced in our allocations, we feel there is an enduring role for bonds in many personal investment portfolios. We maintain a neutral weighting to US stocks, have increased our underweight in international stocks to neutral, and maintained an overweight to flexible-tactical managers who can choose between asset classes based upon the changing dynamics of markets. At all times, we recommend that you maintain a rebalancing process and invest with attention to anticipated liquidity needs, tax situations, etc.

We continue to ask you to stick with the discipline of diversified, balanced investing. In some years, you may ask us why we didn’t hunker down in cash because markets declined. At other times, you might be kicking yourself because a pure stock portfolio is up north of 25% and your diversified returns seem less impressive. Our experience leads us to recommend a broadly diversified portfolio to meet your financial goals and objectives. Thank you for your trust in letting us work with you to meet those goals.

On behalf of everyone at The Center,

Melissa Joy, CFP®

Partner, Director of Investments

Melissa Joy, CFP®is Partner and Director of Investments at Center for Financial Planning, Inc. In 2011 and 2012, Melissa was honored by Financial Advisor magazine in the inaugural Research All Star List. In addition to her frequent contributions to Money Centered blogs, she writes frequent investment updates at The Center and is regularly quoted in national media publications including The Chicago Tribune, Investment News, and Morningstar Advisor.

Financial Advisor magazine's inaugural Research All Star List is based on job function of the person evaluated, fund selections and evaluation process used, study of rejected fund examples, and evaluation of challenges faced in the job and actions taken to overcome those challenges. Evaluations are independently conducted by Financial Advisor Magazine.

The information contained in this report does not purport to be a complete description of the securities, markets, or developments referred to in this material. The information has been obtained from sources considered to be reliable, but we do not guarantee that the foregoing material is accurate or complete. Any information is not a complete summary or statement of all available data necessary for making an investment decision and does not constitute a recommendation. Any opinions are those of Melissa Joy, CFP® and not necessarily those of Raymond James. Expressions of opinion are as of this date and are subject to change without notice. This information is not intended as a solicitation or an offer to buy or sell any investment referred to herein. Investments mentioned may not be suitable for all investors. Prior to making an investment decision, please consult with your financial advisor about your individual situation.

There is an inverse relationship between interest rate movements and bond prices. Generally, when interest rates rise, bond prices fall and when interest rates fall, bond prices generally rise. International investing involves special risks, including currency fluctuations, differing financial accounting standards, and possible political and economic volatility. Investing in emerging markets can be riskier than investing in well-established foreign markets. Diversification and asset allocation do not ensure a profit or protect against a loss. Investing involves risk and you may incur a profit or loss regardless of strategy selected. Individuals cannot invest directly in any index, and index performance does not include transaction costs or other fees, which will affect actual investment performance. Individual investor's results will vary. Past performance does not guarantee future results.

[i] As measured by the S&P 500 index

[ii] As measured by the BarCap Aggregate Bond Index

[iii] US Department of Commerce Bureau of Economic Analysis

[iv] As measured by MSCI EAFE NR USD

[v] Source: JPMorgan Weekly Market Recap 11/18/13

Investment Performance - 3rd Quarter 2013

invcom_performance_2013q3.jpg

Source: Morningstar

US Bonds represented by Barclay's US Aggregate Bond Index a market-weighted index of US bonds. US stocks per S&P 500 Index a market-cap weighted index of large company stocks. Barclay’s Capital Global Bond index is a market-cap weighted index of global bonds. US Small Companies per Russell 2000 Index a market-cap weighted index of smaller company stocks. International stocks measured by MSCI EAFE is a stock market index designed to measure the equity market performance of developed markets outside of the US and Canada. Commodities per Morgan Stanley Commodity Index a broadly diversified index designed to track commodity futures contracts on physical commodities. Barclays Capital US Corporate High Yield Index is an unmanaged index that covers the universe of fixed-rate, noninvestment-grade debt. Barclays Capital US Corporate High Yield Index is an unmanaged indexthat covers the universe of fixed-rate, noninvestment-grade debt.

Inclusion of these indexes is for illustrative purposes only. Keep in mind that individuals cannot invest directly in any index, and index performance does not include transaction costs or other fees, which will affect actual investment performance. Individual investor’s results will vary. Past performance does not guarantee future results.

Shutdown Showdown

invcom_20131001a.jpg
invcom_20131001b.jpg

Americans seemed to be more interested in television’s Breaking Bad finale than Washington proceedings last weekend, but we turned the calendar to October only to welcome the first government shutdown since 1996. With negotiations tied to blockage of new insurance exchanges, it is difficult to see how Republicans and Democrats will ultimately come to agreement and open up America for business as usual.

Here are our economic and investment thoughts on the shutdown:

  • Where only chaos sparks results: You have to wonder if Congress was looking for a very bad reaction to the shutdown in order to spark an incentive to start negotiating with each other. Crisis policy seems to have had the most reliable results when it comes to any semblance of political leadership in the past five years. Our leaders didn’t get such a crisis as US stock markets opened higher on the first day of shutdown (Tuesday, October 1st).
  • Unpopular politics: Voter frustration can be measured in poll results which show that the health care law is unpopular but the government shutdown is even less desirable. Bloomberg reported Tuesday that 72% of American’s opposed a shutdown tied to ObamaCare in a Quinnipiac University poll.
  • The hit to GDP: Growth numbers in the US have already been stymied by fiscal austerity in the form of higher taxes and less spending this year. The biggest impact to those who don’t cash a paycheck from the government or have a trip to a national park planned may be a hit to the US GDP. The 800,000 employees who were sent home represent a workforce larger than Target, Exxon Mobil, General Motors, and Google combined (Tom Keane, Bloomberg Radio, 10/2/13). We should note that the hit might have been higher in past shutdowns as US employment in government jobs has been falling. I tried to pull the exact numbers by accessing the US Census Bureau, but the site was down due to the government shutdown.
  • Silver lining: All the rotten tomatoes being thrown at Congress mask the surprising statistic that the US government budget deficit has been falling rapidly in the last twelve months with an even larger decline anticipated. This does not excuse a failure of governance and does not balance the books overall, but it should be noted as we mourn the loss of decorum or certainty in the function of business in Washington DC.
  • Avoid at all costs: The government shutdown seems to be a prelude to another debt ceiling standoff which many market watchers consider to be much more threatening. It seems absurd that US policymakers would manufacture a crisis rather than providing the ability to pay bills. Given the beltway dysfunction, though, never say never. We’ll keep you posted with our upcoming quarterly investment commentary.

All this bad news masks a US economy whose private sector continues to grow and a growing chorus of statistics that seem to support global recovery from recessions, especially in Europe. Our advice for investors right now is not to let the political tail wag your investment dog. Excepting short-term cash-flow needs, focusing on the long-term may benefit reward investors by using dips as buying opportunities rather than selling to duck and cover.

Melissa Joy, CFP®is Partner and Director of Investments at Center for Financial Planning, Inc. In 2011 and 2012, Melissa was honored by Financial Advisor magazine in the inaugural Research All Star List. In addition to her frequent contributions to Money Centered blogs, she writes frequent investment updates at The Center and is regularly quoted in national media publications including The Chicago Tribune, Investment News, and Morningstar Advisor.

Financial Advisor magazine's inaugural Research All Star List is based on job function of the person evaluated, fund selections and evaluation process used, study of rejected fund examples, and evaluation of challenges faced in the job and actions taken to overcome those challenges. Evaluations are independently conducted by Financial Advisor Magazine.

The information has been obtained from sources considered to be reliable, but we do not guarantee that the foregoing material is accurate or complete. Any opinions are those of Melissa Joy and not necessarily those of Raymond James.

Investment Commentary - 2nd Quarter 2013

While excellent equity market returns coupled with very low volatility have been the name of the game for much of this year, volatility has become the theme in recent weeks as returns across markets have varied quite widely.  Despite this recent volatility Equity returns still look strong to date this year as well as for the past year while bonds and commodities continue to struggle.

In recent weeks the Federal Reserve Bank (the FED) led by Ben Bernanke has been busy!  At their meeting in mid-June they started to give some guidance in which the seemingly unending stimulus that was termed “QE3” (Quantitative Easing) would start to be tapered off.  In September 2012 the FED started buying $40 billion per month of mortgaged backed securities, accelerating that buying to $85 billion per month in December 2012.  Their continued purchasing of this debt was pending the economy improving as measured by the Unemployment rate.  Recently Bernanke stated:

The Committee currently anticipates that it would be appropriate to moderate the monthly pace of purchases later this year; and if subsequent data remain broadly aligned with our current expectations for the economy, we would continue to reduce the pace of purchases in measured steps through the first half of next year, ending purchases around midyear. In this scenario, when asset purchases ultimately come to an end, the unemployment rate would likely be in the vicinity of 7%, with solid economic growth supporting further job gains – a substantial improvement from the 8.1% unemployment rate that prevailed when the Committee announced this program.

Bernanke also stated that the federal funds rate would be kept in the current 0-0.25% range until the unemployment rate headed below 6.5%.  Immediately after this announcement the markets, all markets, sold off.  Domestic and International Equities, Bonds and commodities (most notoriously Gold) all sold off as investors sold first and asked questions later.  Interest rates on the much quoted 10 year Treasury note shot up significantly in the past month.

The selloff in the fixed income markets seemed justified to us, although maybe not across the board.  For the stock markets the reaction seemed  rather extreme because over the course of two days, June 19th and 20th, the S&P 500 was off more than 3 times what the Barclays US Aggregate Bond Index was off, ‑3.84% versus -1.21%. 

Since then positive news has been negative for markets while negative news has been positive.  Signs of an improving economy are met with negative returns because people fear this will accelerate the tapering schedule the FED has laid out.  On the other hand stocks have rallied into poor economic data headlines such as “1st quarter GDP revision of economic growth going from 2.4% to 1.8%.” As equity markets find their footing again we would anticipate this to be a short term anomaly and an improving economy should be met with a positive note by markets going forward but only time will tell.

The bottom line is that QE3 was one of the largest forms of stimulus the FED has applied in its history.  Although 2008 is not yet a distant memory for most, the economy has been improving consistently now for four years.  When put that way it is hard to rationalize these extreme QE measures for too long.  We applaud the FED for its transparency as uncertainty is usually a more negative force in the markets than the actual facts.

On behalf of everyone here at The Center,

Angela Palacios, CFP®

Portfolio Manager

On a lighter note, as many of you know Melissa Joy, Partner and Director of Investments here at the Center, generally brings you our investment commentary.  However, she is taking a much deserved maternity leave after the birth of Josephine Pearl on June 18th!


Required Disclaimers: The information contained in this report does not purport to be a complete description of the securities, markets, or developments referred to in this material. The information has been obtained from sources considered to be reliable, but we do not guarantee that the foregoing material is accurate or complete. Any information is not a complete summary or statement of all available data necessary for making an investment decision and does not constitute a recommendation. Any opinions are those of Angela Palacios and not necessarily those of RJFS or Raymond James. Investments mentioned may not be suitable for all investors.

There is an inverse relationship between interest rate movements and fixed income prices. Generally, when interest rates rise, fixed income prices fall and when interest rates fall, fixed income prices generally rise. U.S. government bonds are issued and guaranteed as to the timely payment of principal and interest by the federal government. Please note that international investing involves special risks, including currency fluctuations, different financial accounting standards, and possible political and economic volatility. Commodities may be subject to greater volatility than investments in traditional securities. Gold is subject to the special risks associated with investing in precious metals, including but not limited to: price may be subject to wide fluctuation; the market is relatively limited; the sources are concentrated in countries that have the potential for instability; and the market is unregulated.

Investment Performance - 2nd Quarter 2013

invcom_20130715.jpg

Source: Morningstar

Bonds represented by Barclay's Aggregate Bond Index a market-weighted index of US bonds. US Large Companies per S&P 500 Index a market-cap weighted index of large company stocks. Barclay’s Global Bond index is a market-cap weighted index of global bonds. US Small Companies per Russell 2000 Index a market-cap weighted index of smaller company stocks. International stocks measured by MSCI EAFE is a stock market index designed to measure the equity market performance of developed markets outside of the US and Canada. Commodities per Morgan Stanley Commodity Index a broadly diversified index designed to track commodity futures contracts on physical commodities. Barclays Capital US Corporate High Yield Index is an unmanaged index that covers the universe of fixed-rate, noninvestment-grade debt. Barclays Capital US Corporate High Yield Index is an unmanaged indexthat covers the universe of fixed-rate, noninvestment-grade debt.

Inclusion of these indexes is for illustrative purposes only. Keep in mind that individuals cannot invest directly in any index, and index performance does not include transaction costs or other fees, which will affect actual investment performance. Individual investor’s results will vary. Past performance does not guarantee future results.