Center Investing

Second Quarter Investment Pulse

Contributed by: Angela Palacios, CFP® Angela Palacios

We’ve been busy with research this quarter. We listened to discussions on everything ranging from interest rates, to the current state of the economy, to social investing. Here’s a peek into what we’ve been learning! 

Jeff Sherman of Doubleline

Jeff is Doubleline’s head of macro asset allocation and a lead portfolio manager. He shared his thoughts on the fixed income markets as well as some interesting insight into the automotive industry.

Jeff feels yield is a good predictor of 12 month returns so if you want to know what types of returns you will get from your bond portfolio you need not look past its yield. Unfortunately, yields are very low right now.

Is there a catalyst for higher rates?

The simple answer, they think, is no. There has to be pressure from somewhere in the economy for rates to rise. GDP (gross domestic product) growth, a general rise in the price of goods (inflation), or wage inflation could trigger rates to rise. They don’t see any of these scenarios happening in the economy right now leading them to believe rates will be on the rise anytime soon. 

Automotive industry worries

They are worried about the automotive market because there have been a lot of subprime loans given to consumers to buy cars. Car dealerships are even starting to lease pre-owned vehicles—because inventories are very high—which has never been done before. Inventories are unusually high right now because cars are lasting longer and Uber is taking over and replacing the need to own a car in many markets. These factors spell trouble for the industry. 

Benjamin Allen of Parnassus

Social investing has been an area of focus for our research over the past couple of years. The process of incorporating a social or ESG overlay to our portfolios for those interested has many more options and research available now. Ben spoke about their process that starts with fundamental research just like any other asset manager. What makes them different is they also apply a lens for social factors including environmental and corporate governance. Their company is 32 years old, completely independent and employee owned. He discussed the importance of this independence in being able to develop their own personal edge for clients which has been a big driver of their success. It sounds like a little company I know…The Center! Our very own 30 year history as independent and employee owned.

Brian Wesbury, Chief Economist for First Trust Advisors

While attending a financial planning conference recently, Matt Trujillo, CFP®, had the opportunity to listen to Brian Wesbury speak. Often seen on CNBC, Fox News, and Bloomberg TV he always has an interesting viewpoint. He touched on two prevalent topics: inflation and current American lifestyles.

On Inflation

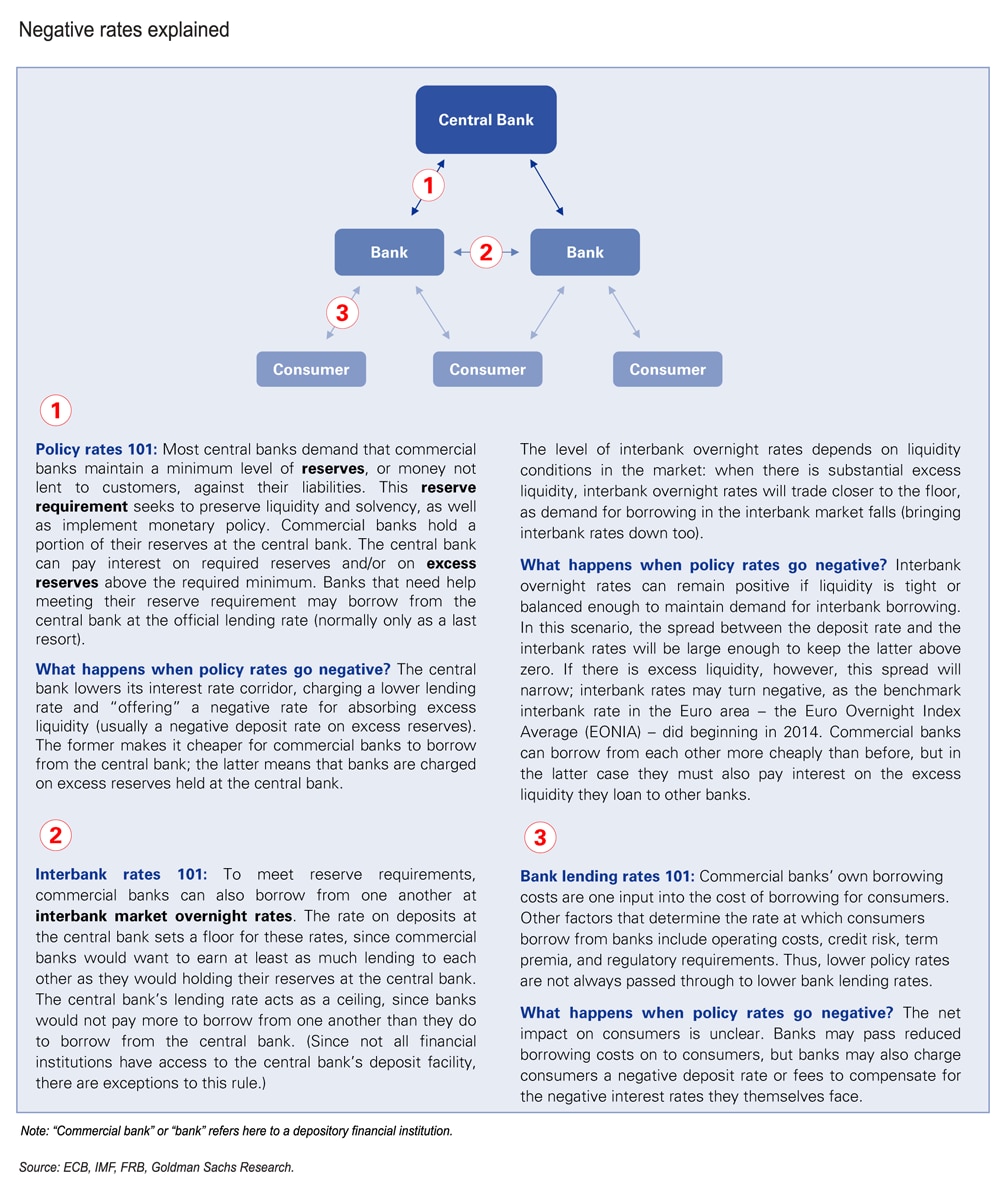
He noted that banks are holding onto large excess reserves and that’s why we haven’t seen much inflation and growth because they aren’t lending the money out. He referred to the M2 money supply which has grown very little over the last 10 years. M2 is a measure of money supply that includes cash and checking deposits (M1) as well as “near money.” “Near money" in M2 includes savings deposits, money markets, and other time deposits, which are less liquid and not as suitable as exchange mediums but can be quickly converted into cash or checking deposits.

On Lifestyle

Brian talked about how there has been very little wage growth but that our lifestyles have still grown due to dramatic innovations in technology. In 1995 if you wanted to purchase 1 Gigabyte of hard drive space it would have cost you $45,000. Then he pulled out his iPhone and said he had 64GB of space, which would have been worth $2.8 Million back in 1995! Another example is Facebook, the world’s most popular media owner, creates no content. Does this increase in lifestyle makeup for the lack of wage increases? He is not the first economist we have heard refer to this phenomenon. I believe that much research is to come on this topic.

Angela Palacios, CFP® is the Portfolio Manager at Center for Financial Planning, Inc. Angela specializes in Investment and Macro economic research. She is a frequent contributor The Center blog.


This material is being provided for information purposes only and is not a complete description, nor is it a recommendation. Any opinions are those of Angela Palacios and are not necessarily those of Raymond James. This information has been obtained from sources considered to be reliable, but Raymond James does not guarantee that the foregoing material is accurate or complete. Raymond James is not affiliated with and does not endorse the opinions or services of Jeff Sherman, Benjamin Allen, Brian Wesbury or the companies/organizations they represent. Investing involves risk and investors may incur a profit or a loss regardless of strategy selected. Past performance is not a guarantee of future results. There is no guarantee that these statements, opinions or forecasts provided herein will prove to be correct.

BREXIT—What the Separation Means for You

Contributed by: Nicholas Boguth Nicholas Boguth

In case you missed it, Great Britain voted to leave the European Union yesterday. Here’s a recap of why this vote took place, what the arguments were on each side, and what the vote means for you, the U.S. investor.

It costs Great Britain nearly $10 billion to be a member of the European Union. What does a country like Great Britain gain from the $10B membership fee? The EU spends its budget on economic stabilization, job creation, and security for European citizens. Its members also get the benefit of being a part of the largest trade bloc in the world.

This vote took place now because David Cameron, Prime Minister of Great Britain, campaigned on the promise that he would negotiate better terms of Great Britain’s membership to the European Union. Great Britain has been at a divide for the past few years when it came to key issues related to the European Union. Proponents of leaving the EU cited issues such as the price tag of membership, weak borders as a result of the EU’s immigration and free movement of people policies, and the limit of business growth because of strict general lawmaking. The argument of those who wanted to remain in the EU was centered on the economic benefit of the trade bloc that allowed for free trade between Great Britain and the other members.

Now that Great Britain has voted to leave the EU, they will begin a two year negotiation to determine the details of the separation - the largest of issues being the details of trade between the now independent Great Britain and the remaining EU member countries.

This vote contributed to investor uncertainty in the previous months, and the decisions that are made over the next couple years will undoubtedly contribute to investor uncertainty as media outlets continue to make noise as they do all too well. The key for investors is to be able to filter through the noise to make well informed decisions. Events such as Brexit are great examples of systematic risk that contributes to volatility and risk in portfolios, something that we continually monitor in our portfolios here at The Center. 

Nicholas Boguth is an Investment Research Associate at Center for Financial Planning, Inc. and an Investment Representative with Raymond James Financial Services.


The information contained in this blog does not purport to be a complete description of the securities, markets, or developments referred to in this material. The information has been obtained from sources considered to be reliable, but we do not guarantee that the foregoing material is accurate or complete. Any opinions are those of Nick Boguth and not necessarily those of Raymond James. There is no guarantee that these statements, opinions or forecasts provided herein will prove to be correct. Investing involves risk and you may incur a profit or loss regardless of strategy selected.

First Quarter 2016 Investment Commentary

Contributed by: Angela Palacios, CFP® Angela Palacios

The relatively benign appearing performance year-to-date of the S&P 500 of 1.35% does not tell the full story of the storm beneath.  Markets started out the year spooked by China and the prospects of four interest rate increases being projected by the Federal Reserve (the Fed).  Recessionary fears seemed to spike mid-February and then recede as economic data such as retail sales, manufacturing, employment, and consumer sentiment came in slightly better than expected or at least didn’t surprise to the downside. 

Janet Yellen, chair of the Fed, ended the quarter with a noticeably dovish speech justifying the Federal Open Market Committee’s lower path for rate increases by citing global growth risks.  The Fed now anticipates only two interest rate increases this year instead of their original four.  Meanwhile, interest rates overseas pushed farther into negative territory while the Bank of Japan introduced their own negative interest rate policy leaving the U.S. as one of the few havens in the world that is still providing yield. 

Last Year’s Losers are this Year’s Winners

2015 positive market returns were driven very narrowly by just a handful of stocks.  This year has turned on a dime with the worst performing companies of 2015 being the best performers in 2016.  The below chart breaks the S&P 500 up into 10 groups based on 2015 performance.  Group one represents the best performing stocks in 2015 and group ten represents the worst performing stocks in 2015.  The green and red bars represent performance from each of these groups during the first quarter of 2016.

0
0
1
4
23
sozo
1
1
26
14.0


Normal
0


false
false
false

EN-US
JA
X-NONE


 <w:LatentStyles DefLockedState="false" DefUnhideWhenUsed="true"
DefSemiHidden="true" DefQFormat="false" DefPriorit…

*Bespoke Investment Group

Moderation in the U.S. Dollar

The dollar slowing its steady advance has helped to ease some of the headwinds for commodities, namely oil, as well as emerging markets debt and equities.  The dollar has given up some of its gains from 2015, due to lowered expectations of the Fed hiking rates.  It is quite common for currency markets to over-react to the monetary policy differences that we are seeing between the U.S. and other countries (negative interest rates overseas versus interest rate increases here at home) so we may yet see the dollar move back into slow strengthening mode.

Summer Real Estate Sizzles

Current housing markets seem to have a severe lack of supply of single family homes similar to the late 1990’s and early 2000’s.  Yet new homes being built are at much lower levels then they were during those years.  Prices will likely continue their upward trend of the past few years as demand continues to exceed supply.  Mortgage rates continue to be low especially after the Fed decided to put on the brakes of raising rates.  All of these factors should equate to a favorable market for home sellers. 

Here is some additional information we want to share with you this quarter:

Checkout the quarterly Investment Pulse, by Angela Palacios, CFP®, summarizing some of the research done over the past quarter by our Investment Department. 

In honor of the Game of Thrones premier, Angie Palacios, CFP®, has also discovered a Game of Negative Interest rates that’s playing out in our world right now. Check out Investor Ph.D.

Confused by interest rates and interbank lending? Nick Boguth, Investment Research Associate, breaks it down for you in Investor Basics by using Game of Thrones.

It’s tax season, which also means refunds may be coming your way! Check out these scenarios from Jaclyn Jackson, Investment Research Associate, and see what the smartest plan for your refund is!

Quarters like this one remind us of the importance of diversification.  While a well-diversified portfolio will likely never generate the highest returns possible it also shouldn’t generate the lowest returns.  The primary goal is to manage your risk and keep the end goal of your financial plan at the forefront.  The key to success in investing is developing that plan with realistic goals and then sticking to it even during times like February when it is tempting to deviate. 

We thank you for your continued trust in us to help you through all types of markets to reach your goals.  If ever you have questions, please, don’t hesitate to reach out to me, your planner or any other members of our staff.

Angela Palacios, CFP®
Director of Investments
Financial Advisor

Angela Palacios, CFP® is the Portfolio Manager at Center for Financial Planning, Inc. Angela specializes in Investment and Macro economic research. She is a frequent contributor to Money Centered as well as investment updates at The Center.


The S&P 500 is an unmanaged index of 500 widely held stocks that is generally considered representative of the U.S. stock market. Keep in mind that individuals cannot invest directly in any index. The foregoing information has been obtained from sources considered to be reliable, but we do not guarantee that it is accurate or complete. Any opinions are those of Angela Palacios and not necessarily those of Raymond James.

First Quarter 2016 Investment Pulse

Contributed by: Angela Palacios, CFP® Angela Palacios

We hit the ground running in the New Year with great insight from outside experts on a wide array of topics ranging from fixed income research to how to conduct a more successful investment committee meeting and nearly everything in between!  Here is a summary of some of the highlights.

Chris Dillon, a global fixed income portfolio specialist with T. Rowe Price

An hour spent listening to Chris was one of the most informative yet exhausting hours of the quarter!  He spent much of his time explaining global complexities within the fixed income markets and how they could affect investors in the coming months.  Of particular interest was a discussion on negative rates and his opinion that we will likely look back on these negative interest rate policies around the world as being completely ineffective.  Also discussed was the coming money market reform here in the U.S. with the formation of Prime Money Markets that will have floating pricing (Net Asset Values).  While these will mostly affect institutional level investors his recommendation was not to purchase these, but they could create a fundamental change in the market place presenting interesting opportunities for short term bond investors.

Bob Collie, Chief Research strategist, Americas Institutional, Russell Investments

Bob discussed the difficulty of working in committees as it isn’t something that comes naturally to most people.  He offered many questions to ask ourselves to understand how our own investment committee measures up to others.  These answers helped identify areas to focus on improving.  Since our investment committee meets at least once a month you can imagine the agendas are usually very packed.  We need to make the most of our time together overseeing portfolios.  Areas we are focusing on improving after listening to Bob have been visioning (what does success of committee work look like), dynamic discussions, and pre-reading of agenda items and background research so we all have time to formulate our points for the discussion ahead of time.  We have already noted improvements during the meeting and outcomes from the meetings.  Hopefully even more improvements are on the horizon!

Jeremy Siegel, Ph.D., Russell E. Palmer Professor of Finance at the Wharton School of the University of Pennsylvania and Senior Investment Strategy Advisor, Wisdom Tree

"Bubble, the most overused word in finance today."

He believes the market has an aggregation bias, if there are a few stocks or a sector that has large losses, like energy does now, the entire market can look skewed.  The energy sector is biasing the P-E index of the market upward making it look more expensive as a whole than it really is.  He thinks fundamentals have driven interest rates to zero rather than artificial means, the FED has simply followed suit reducing interest rates along the way.  Economic growth and risk aversion are the most important determinants of real rates.  Increased risk aversion, aging investors, a desire for liquidity and the de-risking of pension funds has increased demand for bonds forcing their yields lower.  Jeremy has always had a very bullish view on the markets and now seemed no different.  He feels returns over the coming years will fall in line with long term averages.

Angela Palacios, CFP® is the Portfolio Manager at Center for Financial Planning, Inc. Angela specializes in Investment and Macro economic research. She is a frequent contributor to Money Centered as well as investment updates at The Center.


This material is being provided for information purposes only and is not a complete description, nor is it a recommendation. Any opinions are those of Angela Palacios and not necessarily those of Raymond James. The information has been obtained from sources considered to be reliable, but Raymond James does not guarantee that the foregoing material is accurate or complete. Raymond James is not affiliated with and does not endorse the opinions or services of Chris Dillon, Bob Collie, Jeremy Siegel or the companies/organizations they represent. Investing involves risk and investors may incur a profit or a loss regardless of strategy selected. Past performance is not a guarantee of future results. There is no guarantee that these statements, opinions or forecasts provided herein will prove to be correct.

Investor Ph.D. Series: A Game of Negative Interest Rates

Contributed by: Angela Palacios, CFP® Angela Palacios

While many of us, including me, are eager for the new season of Game of Thrones to begin to see what happens next in Westeros, another game is surfacing around our world. Countries around the world are changing the rules of the game by pushing interest rates into negative territory. What happens when this occurs? Winter seems to be inevitable for the citizens in the seven kingdoms but is it inevitable for us?

My colleague Nick Boguth recently wrote a blog explaining the different types of interest rates: Policy, Interbank, and Bank lending rates. Each of the rates is affected differently when interest rates are pushed into negative territory but all are ultimately connected. 

When Policy Rates go Negative

This is the money paid to banks when they deposit their excess reserves with the Central Bank or have to borrow from the Central Bank to meet their reserve requirements. When these rates go negative it makes it cheaper for commercial banks to borrow to meet their reserve requirements but can actually cost the bank money when they park their excess reserves with the Central Bank overnight. Like the Iron Bank of Braavos “The Iron (Central) Bank will have its due.” This encourages banks to look around for something else to do with their excess reserves, like looking to each other to borrow from and lend to rather than the Central Bank. 

When Interbank Rates go Negative

Banks lending to each other is affected by negative rates as they must now pay to lend money to another bank. The only way they would do this is if they had to pay less to loan their money to another bank than to pay to park it at the Central Bank. Neither of these situations is desirable. Institutions desire to earn money on these excess reserves rather than pay to loan to anyone. That has spurred them to buy short-term government debt with their excess reserves to try to seek some yield and the result is that they have pushed Government yields in certain countries, like Germany, into negative territory too. This, in turn, also drags down rates on corporate debt as they are correlated to government bond yields. 

When Bank Lending Rates go Negative

The domino effect of all of these negative rates should pass through to the consumer but doesn’t always show up in lending rates. This negative deposit rate pushes down rates on short-term loans of other types of lending the bank does, like home and auto financing. But other factors, such as credit risk (while a Lannister always pays their debts, consumers don’t) and term premia can put a floor on how low rates can go to the consumer. Favorable lending rates also can be made up with charging consumers more to park their money in the bank. In theory, this downward pressure on rates is supposed to provide an economic boost while also weakening the country’s currency.

No one knows how the series Game of Thrones is going to end as the books have yet to be written. Like the show, the book has not yet been written on the full impact of negative interest rates either. It remains to be seen how this game ultimately ends!


http://www.goldmansachs.com/our-thinking/pages/macroeconomic-insights-folder/negative-interest-rates-101/img-01-slide.png


http://www.wsj.com/articles/everything-you-need-to-know-about-negative-rates-1456700481?cb=logged0.8200769642227588

This material is being provided for information purposes only. Any opinions are those of Angela Palacios and not necessarily those of Raymond James. The information has been obtained from sources considered to be reliable, but Raymond James does not guarantee that the foregoing material is accurate or complete.

Links are being provided for information purposes only. Raymond James is not affiliated with and does not endorse, authorize or sponsor any of the listed websites or their respective sponsors. Raymond James is not responsible for the content of any website or the collection or use of information regarding any website's users and/or members.

Investor Basics: Bank Loans, Interest Rates, and Game of Thrones

Contributed by: Nicholas Boguth Nicholas Boguth

In the spirit of preparing for season six of Game of Thrones, this set of Investor Basics and Investor Ph.D blogs is aimed to discuss bank loans and interest rates with respect to the increasingly popular adventure/fantasy television series. Check out our Director of Investment’s blog “A Game of Negative Interest Rates” HERE.

There are three types of bank loans – 1: Central Bank Loans, 2: Interbank Loans, and 3: Consumer Loans. Each loan is between different parties and has a different interest rate.

Central Banks require commercial banks to meet reserve requirements to ensure their liquidity. At the end of every day, after all of a commercial bank’s clients deposit and withdraw money, if that bank has less than the reserve requirement then it has to borrow money to raise its reserves.

If it has to borrow money to raise its reserves, it has two options. It can either borrow from the Central Bank at the discount rate, or borrow from a fellow commercial bank that has excess reserves at the end of its business day. Commercial banks borrow from each other at the federal funds rate. Currently the discount rate is 1% and the federal funds rate is 0.5%. Obviously, commercial banks prefer to borrow at the lower rate, so interbank lending is much more common than borrowing from the Central Bank. Borrowing from the Central Bank is more of a last resort for commercial banks.

The third interest rate that banks deal with is the bank lending rate. This is the rate that we, the consumers, see when we walk into a commercial bank and ask for a loan. The discount rate and federal funds rate affect banks’ lending rates, but it is also influenced by how creditworthy the customer is, the banks’ operating costs, the term of the loan, and other factors.

For all you Game of Thrones fans, you can think of the Central Bank like the Iron Bank of Braavos. It is the most powerful financial institution in the world, but it only lends to those that can repay debts (e.g. the Central Bank only lends to commercial banks). Not just anyone can borrow from the Central Bank, but the Lannister’s can because “A Lannister always pays his debts.”  SPOILER ALERT coming for anyone who has not made it through season 5: Remember back to season 5 when the Iron Bank is forcing the Iron Throne to repay one-tenth of their debts? Lord Mace offers that House Tyrell could lend the Lannister’s some money so that they could meet the Iron Bank’s “reserve requirement” of one-tenth. This is interbank lending! Thankfully for us, the cost of borrowing money in real life is only the interest rate, whereas in Game of Thrones it could be one’s life.

Nicholas Boguth is an Investment Research Associate at Center for Financial Planning, Inc. and an Investment Representative with Raymond James Financial Services.


This material is being provided for information purposes only. Any opinions are those of Nick Boguth and not necessarily those of Raymond James. The information has been obtained from sources considered to be reliable, but Raymond James does not guarantee that the foregoing material is accurate or complete.

How Should I Use My Tax Refund?

Contributed by: Jaclyn Jackson Jaclyn Jackson

Tax filing season is over and many people are entitled to get money back from Uncle Sam.  While most of us are tempted to buy the latest gadget or book a vacation, there may be a better way to use your tax refund. If you are pondering what to do with your tax refund, here are a few questions to help determine whether you should SAVE, INVEST, or SPEND it.

Have you been delaying one of the following: car repair, dental or vision checks, or home improvement?

If you answered yes: SPEND

If you had to be conservative with your income last year and as a result postponed car, health, or home maintenance, you can use your tax refund to get those things done.  Postponing routine maintenance to save money short term may add up to huge expenses long term (i.e. having to purchase a new car, incurring major medical expenses, or dealing with costly home repairs.)

Do you have debt with high interest rates?

If you answered yes: SPEND

High interest rates really hurt over time. For instance, let’s say you have a $5,000 balance at 15% APR and only paid the minimum each month.  It would take you almost nine years to pay off the debt and cost you an additional $2,118 interest (a 42% increase to your original loan) for a total payment of $7,118. Use your tax return to dig out of the hole and get debt down as much as possible.

Could benefit from buying or increasing your insurance?

If you answered yes: SPEND

  1. Consider personal umbrella insurance for expenses that exceed your normal home or auto liability coverage.

  2. Make sure you have enough life insurance.

  3. Beef up your insurance to protect against extreme weather conditions like flooding or different types of storm damage that are not normally included in a standard policy.  Similarly, you can use your tax refund to physically your home from tough weather conditions; clean gutters, trim low hanging branches, seal windows, repair your roof, stock an emergency kit, buy a generator, etc.

Have you had to use emergency funds the last couple of years to meet expenses?

If you answered yes: SAVE

Stuff happens and usually at unpredictable times, so it’s understandable that you may have dipped into your emergency reserves. You can use your tax refund to replenish rainy day funds.  The rule of thumb is to have at least 3-6 months of your expenses saved for emergencies. 

Are you considered a contract or contingent employee?

If you answered yes: SAVE

Temporary and contract employment has become pretty common in our labor-competitive economy where high paying positions are few and far between. If you paid estimated taxes, you may be eligible for a tax refund. Take this opportunity to build up savings to buffer against slow seasons or gaps in employment. 

Could you benefit from building up retirement savings?

If you answered yes: INVEST

Get ahead of the game with an early 2016 contribution to your Roth IRA or traditional IRA.  You can add up to $5,500 to your account (or $6,500 if you are age 50 or older).  Investing in a work sponsored retirement plan like a 401(k), 403(b), or 457(b) is also recommended so you could beef up your contributions for the rest of the year and use the refund to supplement your cash flow in the meantime. 

Are you interested saving for your child’s college education?

If you answered yes: INVEST

College expenses aren’t getting any cheaper and there’s no time like the present to start saving for your child’s college tuition.  Money invested in a 529 account could be used tax-free for college bills with the added bonus of a state income tax deduction for you contribution.

Could you benefit professionally from entering a certification program, attending conferences/seminar, or joining a professional organization?

If you answered yes: INVEST

It’s always a good idea to invest in your development.  Why not use your tax refund to propel your future?  Try a public speaking or professional writing course; attend a conference that will give you useful information or potentially widen your network.   

Did you answer “no” to all the questions above?

If you answered yes: HAVE FUN

Buy the latest gadget.  Book the vacation.  You’ve earned it!

Jaclyn Jackson is an Investment Research Associate at Center for Financial Planning, Inc. and an Investment Representative with Raymond James Financial Services.


This material is being provided for information purposes only and is not a complete description, nor is it a recommendation. Any information is not a complete summary or statement of all available data necessary for making an investment decision and does not constitute a recommendation. Any opinions are those of Jaclyn Jackson and not necessarily those of Raymond James. You should discuss any tax or legal matters with the appropriate professional. Prior to making an investment decision, please consult with your financial advisor about your individual situation. Please include: Links are being provided for information purposes only. Raymond James is not affiliated with and does not endorse, authorize or sponsor any of the listed websites or their respective sponsors. Raymond James is not responsible for the content of any website or the collection or use of information regarding any website's users and/or members. Hypothetical examples are for illustration purposes only.

Fourth Quarter Investment Commentary

Contributed by: Angela Palacios, CFP® Angela Palacios

2016 kicks off with much of the same challenges as have plagued us for the second half of 2015.  The S&P 500 was up for the seventh straight year but that is where the excitement ended.  Broad markets delivered lackluster or negative returns.  The S&P 500 needed all of its dividends to get to a positive 1.38% return for 2015 while the Russell 2000 and MSCI EAFE representing small company stocks and international markets were down 4.42% and .82% respectively.

Volatility really picked up in the third quarter with a large drawdown while in the fourth quarter made up some ground.  We expect volatility to continue into the New Year as the year end brought no significant changes to our outlook.

Liftoff from Zero

The Federal Reserve Board (FED) continues to ease their foot slowly off the accelerator after years of easy money.  In December, The FED increased short term rates for the first time in nearly a decade.  This move was highly anticipated and thus bonds did not have a large knee-jerk negative reaction.  Bond markets had already priced in the rate move before it happened.

Looking forward, The FED is forecasting 4, quarter point rate increases for a total of a 1% rate increase in 2016.  The markets, as measured by interest rate futures, disagree as they are forecasting only .5% increase this year.  If The FED actually increases rates by 1% the bond market will adjust prices to reflect this leading to slight negative pressures on the prices of bonds.  Interest rates on bank accounts will lag behind the increases and likely only move upward slightly and slowly while mortgage rates should also increase slowly.

A bright spot in the bond market

The outlook for municipal bonds continues to be positive.  Puerto Rico announced a default on January 1 of $37 Million in debt but this was widely anticipated and didn’t spread into other markets.  Many municipalities continue to improve balance sheets with increased tax collection and the market as a whole seems to be on solid footing.

Bond Market Illiquidity

The negative performance in energy prices has led to increasing spreads between high yield bonds and investment grade fixed income.  When this occurs, prices on high yield bonds go down and they become harder to sell.  Over the past several years, investors have reached for yield in this category not understanding the risks involved.  This highlights the importance of understanding exactly what exposure you are taking on when investing in fixed income.

View on Emerging markets

Emerging market challenges continue into 2016.  Manufacturing in China continues to slow as well as their Gross Domestic Product growth, GDP, but the government is intervening in their stock market trying to prove they can provide a floor to asset prices. China’s slowdown has had a negative impact on commodity prices along with the glut in the oil market causing oil prices to be at their lowest levels since early 2009. 

These pressures have been brutal to emerging market country currencies that depend on exporting commodities.  In order for there to be a turnaround in this space we would need to see a change in investor sentiment, stronger economic growth, and a weakening of the U.S. dollar which we don’t see as likely in the near term.

The Economy

Locally our economy continues its slow grind in the positive direction.  Consumer spending remains strong with low gas prices and strong job growth increasing households’ purchasing power.  Housing is a bright spot and as rates increase borrowing terms may be relaxed a bit by lenders which would be helpful.  Inflation may start to pick up slightly from very low levels now.  As energy prices find a bottom this would cease being a negative effect on inflation and may even start to add to year-over-year inflation as we start to rise off the bottom.

Here is some additional information we want to share with you this quarter:

Checkout my research summary in the quarterly Investment Pulse.

Checkout my research summary in the quarterly Investment Pulse.

I delve into Out of the Box Investing with a look at alternative investments.

I delve into Out of the Box Investing with a look at alternative investments.

Melissa Joy, CFP®, Partner, chimes in with a timely reminder of 5 Questions to ask yourself when stocks are down.

Melissa Joy, CFP®, Partner, chimes in with a timely reminder of 5 Questions to ask yourself when stocks are down.

Nick Boguth, Client Service Associate, giving his insight on Style Box Investing basics.

Nick Boguth, Client Service Associate, giving his insight on Style Box Investing basics.

Check out an article on Diversification from Jaclyn Jackson, Research Associate, to help better understand the benefits.

Check out an article on Diversification from Jaclyn Jackson, Research Associate, to help better understand the benefits.

Vice President and Global Market Strategist for J.P. Morgan, David Lebovitz, and The Center's Melissa Joy, CFP®, will discuss timely market and economic insights. REGISTER for the webinar!

Vice President and Global Market Strategist for J.P. Morgan, David Lebovitz, and The Center's Melissa Joy, CFP®, will discuss timely market and economic insights. REGISTER for the webinar!

Careful diversification and financial planning are tools to help support investor patience in choppy markets.  Don’t forget Warren Buffett’s wise advice, “The stock market is a device for transferring money from the impatient to the patient.”  Patience remains a cornerstone to our investment process here at The Center. We appreciate your continued trust.   If you have any questions or would like to discuss further, do not hesitate to reach out to us!

On behalf of everyone here at The Center,

Angela Palacios CFP®
Director of Investments
Financial Advisor

Angela Palacios, CFP® is the Portfolio Manager at Center for Financial Planning, Inc. Angela specializes in Investment and Macro economic research. She is a frequent contributor to Money Centered as well as investment updates at The Center.


David Lebovitz and JP Morgan are not affliated with Raymond James. The information contained in this report does not purport to be a complete description of the securities, markets, or developments referred to in this material. This material is being provided for information purposes only and is not a complete description, nor is it a recommendation. The information has been obtained from sources considered to be reliable, but we do not guarantee that the foregoing material is accurate or complete. Any opinions are those of Angela Palacios and not necessarily those of Raymond James. Past performance may not be indicative of future results. Investing involves risk and you may incur a profit or loss regardless of strategy selected. Investing in emerging markets can be riskier than investing in well-established foreign markets. International investing involves special risks, including currency fluctuations, differing financial accounting standards, and possible political and economic volatility. There are special risks associated with investing with bonds such as interest rate risk, market risk, call risk, prepayment risk, credit risk, reinvestment risk, and unique tax consequences. The S&P 500 is an unmanaged index of 500 widely held stocks that is generally considered representative of the U.S. stock market. The Russell 2000 Index measures the performance of the 2,000 smallest companies in the Russell 3000 Index, which represent approximately 8% of the total market capitalization of the Russell 3000 Index. The MSCI EAFE (Europe, Australasia, and Far East) is a free float-adjusted market capitalization index that is designed to measure developed market equity performance, excluding the United States & Canada. The EAFE consists of the country indices of 22 developed nations. Keep in mind that individuals cannot invest directly in any index, and index performance does not include transaction costs or other fees, which will affect actual investment performance. Individual investor's results will vary.

Don’t Lose Faith in Diversification

Contributed by: Jaclyn Jackson Jaclyn Jackson

As investors, we’ve always been taught that portfolio diversification is essentially for good portfolio performance.  Yet, we’ve experienced three consecutive years that have some of us second guessing that old adage.  Case and point, evaluating the broad bull market from March 2009-December 2012 and the mostly flat market from December 2012–September 2015, it is clear that sometimes diversified asset classes perform well and at other times they do not.  During the period of March 2009 through November 2012, diversification generally helped returns.  From December 2012 until August 2015 diversification away from any “core” asset classes generally hurt returns.

Source: PIMCO

Source: PIMCO

Source: PIMCO

Source: PIMCO

Core asset classes (top) reflect the overall positive direction of the most common markets during both periods. Comparatively, diversified asset classes (bottom) generally helped portfolio returns from 2009-2012 as indicated by the blue lines showing positive returns, but thereafter generally detracted from returns as indicated by the red bars with low to negative performance. Based on this data, it’s easy to consider using a core-only investment strategy without the frills (or frustrations) of diverse investments.  However, there is one key point that we can draw from the diversified asset graph; unlike core assets, diversified assets don’t move in tandem with the market.  Believe it or not, that’s actually what’s great about them.

Many people think diversification is meant to improve returns, but it would be useful to reframe that idea; diversification is meant to improve returns for the level of risks taken. In other words, diversified investments work to balance core investments during down or volatile markets.  Let’s look back at the market bottom of 2009.

The graph illustrates that a non-diversified (stock-only) portfolio lost almost double the amount of a diversified portfolio.  Moreover, the diversified portfolio bounced back to its pre-crisis value more than a year before the stock-only portfolio.  This type of resilience is especially important for retired investors that rely on income from their portfolios. 

Not only is portfolio diversification useful for people who’ve met investment goals, it is equally helpful to long-term investors.  For investors still working toward financial goals, portfolio diversification can help produce more consistent returns, thereby increasing the prospects of reaching those goals.  The diagram below ranks the best (higher) to worst (lower) performance of 10 asset classes from 1995-2014.  The black squares represent a diversified portfolio.

Source: SPAR, FactSet Research Systems Inc.

Source: SPAR, FactSet Research Systems Inc.

The black squares generally middle the diagram.  As evident, the range of returns for a diversified portfolio was more consistent than individual asset classes.  Returns with less variability are more reliable for setting long-term investment goals.

Admittedly, portfolio diversification over the last three years has made it difficult for many to stick with their investment strategy.  Yet, portfolio diversification still holds merit: it can help mitigate portfolio risk; it can boost portfolio resilience; and it can provide investors the consistency necessary to set and meet financial goals.

Jaclyn Jackson is a Research Associate at Center for Financial Planning, Inc.


This material is being provided for information purposes only and is not a complete description, nor is it a recommendation. Any opinions are those of Jaclyn Jackson and not necessarily those of Raymond James. The information has been obtained from sources considered to be reliable, but Raymond James does not guarantee that the foregoing material is accurate or complete. Diversification and asset allocation do not ensure a profit or protect against a loss. Investing involves risk and investors may incur a profit or a loss regardless of strategy selected. Past performance is not a guarantee of future results. The S&P 500 is an unmanaged index of 500 widely held stocks that is generally considered representative of the U.S. stock market. Keep in mind that individuals cannot invest directly in any index, and index performance does not include transaction costs or other fees, which will affect actual investment performance. Individual investor's results will vary.

The historical performance of each index cited is provided to illustrate market trends; it does not represent the performance of a particular MFS® investment product. It is not possible to invest directly in an index. Index performance does not take into account fees and expenses. Past performance is no guarantee of future results. The investments you choose should correspond to your financial needs, goals, and risk tolerance. For assistance in determining your financial situation, consult an investment professional. For more information on any MFS product, including performance, please visit mfs.com. Investing in foreign and/or emerging market securities involves interest rate, currency exchange rate, economic, and political risks. These risks are magnified in emerging or developing markets as compared with domestic markets. Investing in small and/or mid-sized companies involves more risk than that customarily associated with investing in more-established companies. Bonds, if held to maturity, provide a fixed rate of return and a fixed principal value. Bond funds will fluctuate and, when redeemed, may be worth more or less than their original cost. Note that the diversified portfolio’s assets were rebalanced at the end of every quarter. Diversification does not guarantee a profit or protect against a loss. to maintain the equal allocations throughout the period. Standard deviation reflects a portfolio’s total return volatility, which is based on a minimum of 36 monthly returns. The larger the portfolio’s standard deviation, the greater the portfolio’s volatility. Investments in debt instruments may decline in value as the result of declines in the credit quality of the issuer, borrower, counterparty, or other entity responsible for payment, underlying collateral, or changes in economic, political, issuer-specific, or other conditions. Certain types of debt instruments can be more sensitive to these factors and therefore more volatile. In addition, debt instruments entail interest rate risk (as interest rates rise, prices usually fall), therefore the Fund’s share price may decline during rising rate environments as the underlying debt instruments in the portfolio adjust to the rise in rates. Funds that consist of debt instruments with longer durations are generally more sensitive to a rise in interest rates than those with shorter durations. At times, and particularly during periods of market turmoil, all or a large portion of segments of the market may not have an active trading market. As a result, it may be difficult to value these investments and it may not be possible to sell a particular investment or type of investment at any particular time or at an acceptable price. https://www.mfs.com/wps/FileServerServlet?articleId=templatedata/internet/file/data/sales_tools/mfsvp_20yrsb_fly&servletCommand=default

Investment Basics: Style Box Investing

Contributed by: Nicholas Boguth Nicholas Boguth

Among the plethora of data points used to describe any security, there are two that are fundamental for a basic understanding of  stocks and bonds. For equities, the two pieces of data are market capitalization (size) and investment style (value/growth). For fixed income securities, the data points are interest rate sensitivity (duration) and credit quality.  These characteristics are important parts of every security’s risk/return profile, and are key in determining if and how an investment should fit in your portfolio.

In order to help investors easily identify these two key characteristics of securities, Morningstar created a useful tool – the style box. There is a separate box for equities and fixed income securities. The equity style box shows value to growth investment styles on the horizontal axis and small to large market caps on the vertical axis.  For fixed income, the horizontal axis shows limited to extensive interest rate sensitivity and the vertical axis shows low to high credit quality.

As investors, the first decision you have to make is to determine your capacity for risk. Once determined, you are able to choose investments that align with the level of risk you are willing to take.  Growth stocks typically carry more risk than value stocks, and small-cap stocks are usually riskier than large-cap.  Bonds can have limited to extensive interest rate risk based on duration (longer duration = more interest rate risk), and a bond with low credit quality is normally riskier than one with high credit quality.  Looking at the style box, this means that a security that falls in the bottom-right square will typically bear more risk (and hopefully opportunity for more return), and a security that falls in the top left box will typically have less risk. 

The style box is especially useful because not only does it indicate those fundamental data points of a single security, but you can plot all your investments on it to see the characteristics of your entire portfolio as well.   Not every individual security chosen for your portfolio has to match your exact risk profile.  In fact, when you build a portfolio, you may diversify and end up with securities that scatter all over the style box.  The suitability of investments refers to your portfolio as a whole, not individual investments, so it is acceptable to have some lower risk and some higher risk securities.  That being said, the style box does not operate on tic-tac-toe-like rules where a diversified portfolio is one with all of the boxes checked off.  It does not explain everything there is to know about a diversified portfolio, but it is a very useful tool that is essential to investment basics.

Nicholas Boguth is a Client Service Associate at Center for Financial Planning, Inc.


This material is being provided for information purposes only and is not a complete description, nor is it a recommendation. Any opinions are those of Nick Boguth and not necessarily those of Raymond James. The information has been obtained from sources considered to be reliable, but Raymond James does not guarantee that the foregoing material is accurate or complete. Investing involves risk and investors may incur a profit or a loss regardless of strategy selected. Prior to making an investment decision, please consult with your financial advisor about your individual situation. Diversification and asset allocation do not ensure a profit or protect against a loss. Investments mentioned may not be suitable for all investors. Past performance is not a guarantee of future results.