Investment Planning

The Seasons of the Markets

 One of the Center’s Core investment beliefs is in “Market Cycles and Risk”. Before I explain our approach, I think it’s essential to remember that just about everything is cyclical.  There’s little I’m certain of but I do know this: Nothing goes in one direction forever.  Trees don’t grow to the sky. And there are few things as dangerous for investor health as insistence on extrapolating today’s events in the future.

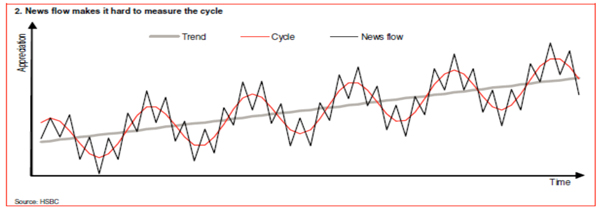
(Above is a sample chart of cycles with a discernible trend over time)

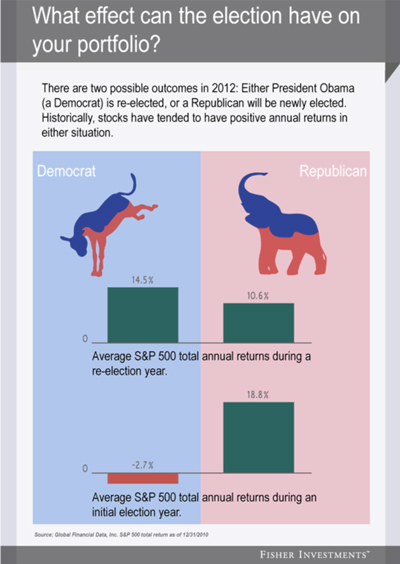
Our lives are full of different types of cycles.  There are those that occur naturally, like the cycle of life and those cycles that are biologically driven. There are also manmade cycles like the presidential cycle and the workweek cycle.  Ever wonder where we are in the current economic cycle or market cycle? Economic and market cycles are not quite as spherical, but they have different seasons and they do typically rotate in a circular fashion over time.

Below is a graph of the market cycle. The Pink/Purple is the fall at the top is fall, the Red is winter and the capitulation and bottoming process, Green represents the spring a thawing out of a new bull market, and Blue is the summer representing the bull market.  Luckily, in the seasons of the market, summer is usually 2-3 times longer than winter, same with contraction and expansionary periods in the economy.  

Very few people can consistently pick bottoms of markets within months and even fewer can pick market tops with any accuracy. Some of the best investment strategists make predictions that are years off the mark. But understanding the season is something that we try to do at the Center.  In our approach, we attempt to manage the exposure to equities during the late fall and early winter as some inevitable downturns can get very difficult for investors.  However, we also attempt to get back to normal allocations in the late winter and early spring.  We call this rebalancing and tactical asset allocation of a portfolio.  Adding to underweighted asset classes can be emotionally difficult for most investors to do during the winter and spring season when it seems like things in the world are falling apart. 

Most people would guess that we are currently in the summer or fall of the current economic cycle.  That’s when investors are comfortable, more at ease with a sense of relief and even optimism and excitement can prevail.  However, this cycle will end and again we will find ourselves with a different season where markets are uncomfortable and statements are not as cheery.   Another winter will be looking us in the face again.   Try to remember what was going on both internally (your stomach) and externally (the newspaper, fundamentals and technical indicators) in the last trough and it can help with the next one.  Because it’s in the winter that opportunity exists, you just have to remember it doesn’t always feel like opportunity. 


The information contained in this report does not purport to be a complete description of the securities, markets or developments referred to in this material.  The information has been obtained from sources considered to be reliable, but we do not guarantee that the foregoing material is accurate or complete.  Any information is not a complete summary or statement of all available data necessary for making an investment decision and does not constitute a recommendation.  Any opinions are those of Center for Financial Planning and not necessarily those of RJFS or Raymond James.  Investing involves risk and investors may incur a profit or a loss.  Past performance may not be indicative of future results.

Euro 101: Will the Euro Survive?

 This is the million-dollar question of recent history.  There is no clear-cut answer but William James Adams PhD, professor and expert on the European economy, thinks the Euro may survive.  There are two major opposing viewpoints to this question.  The first is the “Anglo-Saxon View” and second is the Continental Theory.

Anglo-Saxon View

This view is based on optimal currency area theory and examines whether or not an area would benefit from a common currency.  In order for a common currency to work, there must be at least one of the following tools available to the people:

  1. Labor mobility – Since there are major cultural differences and language barriers mobility, or the opportunity to move where the jobs are, between European countries is severely lacking for employees.
  2. Price and wage flexibility – Prices are very sticky, for example companies can’t just double the price of pasta because customers will simply buy something else instead.
  3. Transfer of tax revenues from one region to the other – This works in the U.S because the Federal government takes in $162 of tax revenue of every $100 in state tax revenue, so there is a lot to spread around as they see fit. In contrast, in Europe, the European Union only has $3 in revenue for every $100 of country revenue.

Supporters of the Anglo-Saxon view, feel that the currency has been doomed from the start. 

The Continental View

When the U.S. dollar came about, none of the above scenarios were in place for almost 150 years and yet the dollar survived.  This is the argument that proponents of the Continental View take.

These days, countries making a trade across borders of member nations, say from Germany to Spain, benefit greatly from the elimination of transaction costs and hedging of currency conversions that previously occurred.  Also, if the Euro didn’t exist, a deflationary bias could occur, which would hurt the sale of goods.  This happens when member nations start to adjust their interest rates to be more competitive and attract more investment money.

Ultimately, it is not in any country’s best interest to let the Euro collapse since they depend on exports to other European Union countries for their livelihoods.  As there is no clear cut answer, it will be interesting to continue to follow the developments across the Atlantic Ocean.  We are continually monitoring the situation in light of how this may impact our client’s portfolio. For more detailed information on how the Euro Zone crisis began, take a look at the other blogs in our Euro 101 series.

Please see the rest of the posts in our Euro 101 Series:

Lesson 1: A Little History Behind the Euro Zone Crisis

Lesson 2: Who’s in the Euro Zone and Why Was It Established?

Lesson 3: The Beginning of the End

Lesson 4:  Scandals


The information contained in this report does not purport to be a complete description of the securities, markets or developments referred to in this material.  The information has been obtained from sources considered to be reliable, but we do not guarantee that the foregoing material is accurate or complete.  Any information is not a complete summary or statement of all available data necessary for making an investment decision and does not constitute a recommendation.  Any opinions are those of Center for Financial Planning, Inc., and not necessarily those of RJFS or Raymond James.  Expressions of opinion are as of this date and are subject to change without notice.

Euro 101: Scandals

 What does the country of Greece have in common with companies like Enron, WorldCom and Tyco International?  The answer: Accounting scandals of epic proportions! 

History Lesson 4

In 1992 the creation of the Maastricht Treaty required all members of the Eurozone to limit their Deficit spending and total debt levels in relation to their Gross Domestic Product (GDP), laying the groundwork for later establishment of the Euro as a common currency.  The parameters for Government finance are:

  1. The yearly deficit that the individual country runs may not exceed 3% of the annual GDP of the country.  Exceptions to this must be approved.
  2. Government Debt as a percent of GDP must not exceed 60%; however, there are only a couple of Eurozone countries that meet this criteria now.  As a whole the Eurozone countries average over 90% as shown in the chart below. 

Because of these requirements, countries like Greece (who far exceeds the 60 % acceptable level at 161% Debt to GDP) and Italy got more creative with their accounting methods and ignored internationally agreed upon standards in order to stay part of the Eurozone and use the Euro as their currency.  Leaders masked their deficit and debt levels through a combination of techniques, including inconsistent accounting, off-balance-sheet transactions (like leaving out large military expenditures or billions in hospital debt) as well as the use of complex currency and credit derivatives structures. 

Two years ago Greece had to fess up to these lies because they were unable to repay their debt.  There was a loss of confidence prompting the rescue by other Eurozone countries, as they were the holders of much of this debt, and the International Monetary Fund.

This brings us to where we are today and one of the major questions the world is debating... ”Whether or not the Euro will survive”.  I will discuss some of these opposing viewpoints in the next and final installment of this series.

Source:  Spiegel Online International

Link to:

Lesson 1: A Little History Behind the Euro Zone Crisis

Lesson 2: Who’s in the Euro Zone and Why Was It Established?

Lesson 3: The Beginning of the End


The information has been obtained from sources considered to be reliable, but we do not guarantee that the foregoing material is accurate or complete.  Any opinions are those of Center for Financial Planning, Inc., and not necessarily those of RJFS or Raymond James.

Euro 101: The Beginning of the End

 Europe is no stranger to crisis.  Not all of their crises are self-imposed, however.  Popular as it may be to blame the Europeans for the current crisis, we must dig a bit deeper to get at some of the root causes of today’s problems and look more globally. 

In 1971, President Nixon pulled out of the Bretton Woods Accord removing the gold backing from the US Dollar (during Bretton Woods the US dollar had been pegged to the price of gold and all other currencies were pegged to the US dollar), allowing the dollar to float as it does today. This action had far-reaching consequences.  Shortly thereafter, many European countries followed suit with their currencies.

Nations, including the US, started to increase their reserves by printing money in large amounts essentially decreasing the value of their currencies.  Because oil was priced in US dollars, this resulted in an immediate pay cut to the oil producers. The Organization of Petroleum Exporting Countries (OPEC) eventually answered by pricing a barrel of oil against gold instead.

This domino effect ultimately caused the "Oil Shock" of the mid-1970s.  For two decades prior, the price of oil in U.S. dollars had risen very slowly and steadily by less than two percent per year.  Look at the blue (Nominal) line in the graph below, that is the oil price unadjusted for inflation.  Suddenly after 1971, oil became extremely volatile and expensive. 

http://en.wikipedia.org/wiki/1973_oil_crisis

To add insult to injury, oil exports were limited to many European nations. This led to a drastic slowdown in the European standard of living in the 1970’s causing the local governments to take on more and more debt to mitigate these effects. And so it began until the establishment of the Maastricht Treaty, which I will discuss in our next lesson.

Lesson 1:  A Little History Behind the Euro Zone Crisis

Lesson 2:  Who’s In the Euro Zone and Why Was It Established?


The information contained in this report does not purport to be a complete summary or statement of all available data necessary for making an investment decision and does not constitute a recommendation.  The information has been obtained from sources considered to be reliable, but we do not guarantee that the foregoing material is accurate or complete.  Any information is not a complete summary or statement of all available data necessary for making an investment decision and does not constitute a recommendation.    Any opinions are those of Center for Financial Planning, Inc., and are not necessarily those of RJFS or Raymond James.  Past performance may not be indicative of future results.  Gold is subject to the special risks associated with investing in precious metals, including but not limited to:  price may be subject to wide fluctuation; the market is relatively limited; the sources are concentrated in countries that have the potential for instability; and the market is unregulated.  Investing in oil involves special risks, including the potential adverse effects of state and federal regulation and may not be suitable for all investors.

Great Investment Performance is Not Enough

 "The economy is suffering" and "Job loss" and "Euro crisis" ... you've likely been reading a lot of bad news about the economy lately. Especially in this election season, the worst often gets pushed center stage in campaign ads and speeches. But instead of focusing on the buzz, take a look at the facts. Below is a chart of returns over the past year from 8/20/2011 to 8/21/2012.  The S&P 500 returned over 28% including dividends!!!

Source: Morningstar Direct

This has happened during a time when:

  • United States Treasuries lost their coveted AAA rating from S&P debt rating agency
  • National Unemployment remains high
  • The Euro Zone continues to be engulfed by concerns over debt

And that is just to name a few of the scary headlines we’ve witnessed over the past year. Regardless, though, the market continues to march on.

Unfortunately, the average investor has been divesting in the U.S. markets consistently since 2008 rather than investing. The chart below shows that the average retail investor (that is you and me), represented by the blue and orange areas, has been consistently pulling money out of US stocks while institutions, represented by the green area, have been consistently investing.

Source: Morningstar Direct

You might ask where has the money been going.

  • A large amount has been flowing into U.S. Bonds (despite the downgrade and historically low interest rates)
  • Some has left the market to pay down consumer debt
  • Many are moving over to exchange traded instruments to find their U.S. Stock exposure

It is hard to say if the average investor is permanently scared away from buying U.S. Stocks, but do not count on the media to make it feel any easier!


The information contained in this report does not purport to be a complete description of the securities, markets, or developments referred to in this material.  The information has been obtained from sources considered to be reliable, but we do not guarantee that the foregoing material is accurate or complete.  Any information is not a complete summary or statement of all available data necessary for making an investment decision and does not constitute a recommendation.  Any opinions are those of Center for Financial Planning, Inc., and not necessarily those of RJFS or Raymond James. The S&P 500 is an unmanaged index or the 500 widely held stocks that are generally considered representative of the U.S. stock market.  Inclusion of these indexes is for illustrative purposes only.  Keep in mind that individuals cannot invest directly in any index, and index performance does not include transaction costs or other fees, which will affect actual performance.  Individual investor’s results will vary.  Past performance does not guarantee future results.  Dividends are not guaranteed and must be authorized by the company’s board of directors.

Euro 101: Who’s In the Euro Zone and Why Was It Established?

 When you think of Europe, your mind might immediately start plotting your “bucket list” of vacation destinations. That happens whenever I see a map like the one below, but this picture actually brings us to the next lesson on Europe.  Could you imagine changing currencies every time you drove up to the Upper Peninsula or over to Chicago?  While we are somewhat used to that when we go over the bridge to Canada, most of the United States is not.  However, that is what living in Europe was like until 1999, when the Euro Zone was established.

Lesson #2

What is the Euro Zone?

In contrast to the European Union’s large membership of 27 countries, the Euro Zone consists of only 17 of those 27 countries.  This is an Economic and Monetary union of these countries.  They have all accepted the Euro as their sole legal currency.  The Euro Zone currently consists of Austria, Belgium, Cyprus, Estonia, Finland, France, Germany, Greece, Ireland, Italy, Luxembourg, Malta, the Netherlands, Portugal, Slovakia, Slovenia, and Spain.

According to the European Commission, the benefits of the euro are diverse and are felt on different scales, from individuals and businesses to whole economies. They include:

  • More choice and stable prices for consumers and citizens
  • Greater security and more opportunities for businesses and markets
  • Improved economic stability and growth (Okay, maybe this one is up for debate)
  • More integrated financial markets
  • A stronger presence for the EU in the global economy
  • A tangible sign of a European identity

The European Central Bank (ECB) was established to administer the Euro Zone.  The ECB controls monetary policy similar to our Federal Reserve Bank in the U.S.  Their main goal is to keep inflation under control by setting interest rates.  Lately they have had to become a buyer of member countries bonds in order to help bring their rates (borrowing costs) down for countries like Spain and Italy. 

I was fortunate enough to spend three years living in Germany after the Euro Zone was created.  We found ourselves traveling from Germany to other Eurozone countries for long weekends as easily as driving to Chicago for a visit.  If I felt this way as an individual, you can imagine the impact this has had for business.


The information has been obtained from sources considered to be reliable, but we do not guarantee that the foregoing material is accurate or complete.  Any opinions are those of Center for Financial Planning, Inc., and not necessarily those of RJFS or Raymond James.

Euro 101: A Little History Behind the Euro Zone Crisis

 With the Olympics in winding down, all eyes have been on Europe now for a change…oh wait…I guess we are already sick of hearing about Europe.  Well at least this was a welcome distraction from the now household name, Angela Merkel, and the European Debt debacle. 

I was recently at the Morningstar Conference in Chicago and had the privilege to listen to William James Adams PhD, an Economics’ professor at University of Michigan.  Professor Adams is known for his expertise on the European economy and its history.  He was the last speaker at the end of a three-day conference and many of the attendants remained to hear his presentation “How Fragile Is the Euro”.  I think this speaks to the appetite of everyone for information on the Euro Zone and what could potentially happen.  It is an area that we will all need to be well versed on in the coming months and years, if we aren’t already, in order navigate these investment waters.

In a part of his presentation, Professor Adams brushed us up on Europe 101. I think we all can benefit from revisiting the background of Europe in light of  the focus on the Euro’s end game.  In the coming weeks, I will attempt to present a brief history of the European Union, the Euro Zone and the policies that lead them to where they are today.  I hope you find this history lesson as valuable and refreshing as I have and, much like the Olympics, a welcome break from the endless Euro collapse headlines! 

Lesson #1:

What is the European Union?

The European Union began with the Treaty of Paris in 1951.  It is a system of government meant to establish diplomatic and economic stability originally between 6 countries, France, West Germany, Italy, Belgium, Luxembourg and the Netherlands.  It has since expanded to include 27 different countries speaking 23 different languages.  See the graphic below for the current members.

Source: en.wikipedia.org

You can also view an animated chart at http://en.wikipedia.org/wiki/File:EC-EU-enlargement_animation.gif showing the order of accession of the countries starting in 1957.


Links are being provided for information purposes only.  Raymond James is not affiliated with and does not endorse, authorize or sponsor any of the listed websites or their respective sponsors.  Raymond James is not responsible for the content of any website or the collection or use of information regarding any website’s users and/or members.

Around the Water Cooler at The Center

 We find ourselves in the middle of summer again and more than half way through the year.  Here at The Center, this is the time of year when we are digging into the most intense research and doing some very “deep thinking”. A heavy dose of conferences and speakers in the spring gave us much food for thought, and now we find ourselves at a time in the year where the schedule seems a bit lighter, no doubt due to our clients out enjoying their well-deserved summer vacations. So, while you may be thinking about relaxing, here’s what we’re thinking about at The Center:

  • Around the world, government intervention has caused interest rates to fall due to slowing growth in China and Euro Crisis. Can they go even lower?
  • A surprising slowdown in overall US debt growth has been occurring under our noses. No, the US federal debt load keeps growing, but there has been measurable deleveraging on the state and household levels.

  • The Affordable Care Act was largely upheld by the Supreme Court last month having implications for Americans and their investment and tax strategy in all walks of life.

  • Scandalous headlines are resurfacing at big banks, most recently JP Morgan and Barclays

This is more than water cooler talk for us, we are busy working these landmark changes into our strategies for the future. To find out more about what’s catching our attention, check out our Quarterly Investment Commentary.

Elections and the Markets: Landslide victories and divided governments

 While I was only in grade school at the time, many of you may remember the landslide victory of Ronald Reagan in 1984.  He not only won 59% of the popular vote, he also had the highest number of electoral votes (525) over Walter Mondale.  If you were lucky enough to be an investor at this time, you will remember this was the start of a strong bull market run for domestic stocks.  But are landslide victories always this good for investors? 

The short answer is “no,” but there have not been enough landslide victories to get a good sample set to draw conclusions.  The markets don’t necessarily like them because overwhelming victories by either party means the politician could have more power to invoke change and that could mean potentially higher economic policy risk resulting in higher inflation or interest rates on the horizon.

A divided government can alleviate much of this concern as it brings with it the benefits of legislative check and balances.  During Reagan’s era, Democrats controlled the House while Republicans were the majority in the Senate for 6 of his 8 years as President. All parties had to work together to create the successful policies like the 25% across the board tax reduction, deregulation and corporate tax cuts that stimulated the economy and markets onward and upward.

So how does this play out in the 2012 election?  It may feel like the election is close, but consider that the GOP still hasn’t officially nominated a candidate.  Polls tend to favor Obama against presumptive nominee Mitt Romney, but there are still four important months left of campaigning.  It doesn’t appear, at this point in the race, as though a win will be a Reagan-like landslide.  What it will mean for the markets remains as much of a mystery as which candidate will win on November 6th.

Source: FederatedInvestors.com


The information has been obtained from sources considered to be reliable, but we do not guarantee that the foregoing material is accurate or complete.  Any information is not a complete summary or statement of all available data necessary for making an investment decision and does not constitute a recommendation.  Any opinions are those of RJFS or Raymond James.  Past performance may not be indicative of future results.

Elections and the Markets: Better returns on the horizon?

 In 2012, we either re-elect a Democrat or newly elect a Republican—history shows either can be a sweet spot for stocks. Stocks have averaged 14.5% historically in election years a Democrat is re-elected and 18.8% when a Republican is newly elected.

Source: Global Financial Data, Inc. S&P total return as of 12/31/10

When looking at the above returns, it may be hard to believe that we could end up with those kinds of returns by the end of the year … especially with the strong pullback we have seen recently.  In light of this recent pullback in the markets, both domestically and internationally, it is important to revisit a chart we have shared before.  It serves as an important reminder of the volatility experienced each year and the returns that investors end up having the potential to earn despite these pullbacks.

Of course you have no control over the market’s ups and downs or who gets elected, aside from your vote, to serve as the President of the United States, but you can be better prepared to weather these volatile cycles if you focus on factors you can control like staying fully invested.


The S&P 500 is an unmanaged index of 500 widely held stocks that are generally considered representative of the U.S. stock market.  Inclusion of this index is for illustrative purposes only.  Keep in mind that individuals cannot invest directly in any index, and individual investor’s results will vary.  Past performance does not guarantee future results.  The information contained in this report does not purport to be a complete description of the securities, markets, or developments referred to in this material.  Any information is not a complete summary or statement of all available data necessary for making an investment decision and does not constitute a recommendation.  Any opinions are those of Center for Financial Planning, Inc., and not necessarily those of RJFS or Raymond James.