Investment Planning

Elections and the Markets: What have you done for me lately?

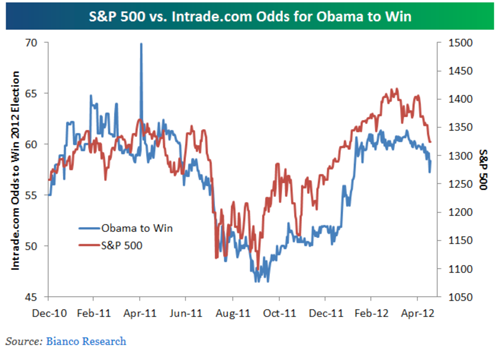
 It’s not just a catchy Janet Jackson song, it’s a question many voters are going to be asking of the President when they head to the polls this November.  One indicator that seems to be more effective than any campaign ad for voters is the stock market. The chart below shows just how highly correlated the odds are that Obama is going to win (based on voter polling from Intrade.com) with the S&P 500.  The higher the S&P come voting time, the more likely he should be to win the election.


In a study done by John Nofsinger, "The Stock Market and Political Cycles," which was published in The Journal of Socio-Economics in 2007, Nofsinger proposed that the stock market may be able to predict which candidate will be elected. He analyzed the relationship between the social mood of the country and the presidential election and concluded that when the country is optimistic about the future, the stock market tends to be high and voters are more likely to vote for those in power. When the social mood is pessimistic, the market is low and people tend to vote out the incumbent and put a new party in power.  

So, while Janet Jackson had relationships in mind rather than elections when she helped write the song, “What Have You Done for Me Lately”, if you can look past those mid-1980’s shoulder pads and frizzy hair, you can find she hits a chord when it comes to how we elect the leaders of our country!


The information contained in this report does not purport to be a complete description of the securities, markets, or developments referred to in this material.  The information has been obtained from sources considered to be reliable, but we do not guarantee that the foregoing material is accurate or complete.  Any information is not a complete summary or statement of all available data necessary for making an investment decision and does not constitute a recommendation.  Any opinions are those of Center for Financial Planning, Inc., and not necessarily those of RJFS or Raymond James.  Past performance may not be indicative of future results.  You cannot invest directly in an index.

Links are being provided for information purposes only.  Raymond James is not affiliated with and does not endorse, authorize or sponsor any of the listed websites or their respective sponsors.  Raymond James is not responsible for the content of any website or the collection or use of information regarding any website’s users and/or members.

Elections and the Market

 It's election season…again!  While the mudslinging between candidates and special interest groups ramps up, how will the stock markets react? 

History suggests that investors can benefit from paying attention to the presidential election cycle.  Yale Hirsch, a stock market historian and the creator of the Stock Trader’s Almanac, has developed the presidential election cycle theory.  This study, among others, supports evidence that there is a significant relationship between the presidential cycle and the stock market.  

Here is what returns look like on the average election cycle verses our current election cycle:

Source: S&P500 Total Return Index

Year 1: The Post-Election Year
Of the four years in a presidential cycle, the first-year performance of the stock market, on average, is the worst; however, so far with the current administration, it has been the best. We recovered sharply immediately following the financial crisis of 2008.

Year 2: The Midterm Election Year
The second year, although historically better than the first, this time has trailed the strong performance of the first year.

Year 3: The Pre-Presidential Election Year
The third year (the year proceeding the election year) is the strongest on average of the four years, but with the European concerns, ended up being the worst of the cycle so far.

Year 4: The Election Year
In the fourth year of the presidential term and the election year, the stock market's performance tends to be above the overall average.

While the current cycle seems to be turned on its head, it is still worth exploring different election scenarios and how they affect the markets.

  • What if a Democrat wins? What if a Republican wins?
  • What if the race is close? What if it is a landslide?
  • Can the stock market predict an election winner?

While the candidates are busy posturing for the election, we will explore some scenarios and how to posture your portfolio accordingly in the coming weeks.


The S&P 500 is an unmanaged index of 500 widely held stocks that’s generally considered representative of the U.S. stock market.  Keep in mind that individuals cannot invest directly in any index, and individual investor’s results will vary.  Past performance does not guarantee future results.  The information contained in this report does not purport to be a complete description of the securities, markets, or developments referred to in this material.  The information contained in this report does not purport to be a complete description of the securities, markets, or developments referred to in this material.  The information has been obtained from sources considered to be reliable, but we do not guarantee that the foregoing material is accurate or complete.  Any information is not a complete summary or statement of all available data necessary for making an investment decision and does not constitute a recommendation.  Any opinions are those of Center for Financial Planning, Inc., and not necessarily those of RJFS or Raymond James.

Sell in May and Go Away

 Along with the warm weather, spring always brings about the old debate of whether it is a good idea to, “Sell in May and go away.”  Markets tend to have their stronger performance between October and May, which has certainly held true in the past year. 

There are many theories as to why this could be true:           

  • Investors tend to fund their IRA accounts either early or later in the year
  • Lower summer productivity for business
  • And the most obvious, people prefer to be outside rather than inside investing their money
    (especially in Michigan).

However, this year could be different. If you look at monthly returns in Election years (which like it or not we are in the middle of) the above picture is contradicted.

Beware of strategies involved in short-term timing of the markets.  Many investors end up hurting themselves by trying to time their investments in and out of the market.


Source:  The Big Picture  http://www.ritholtz.com/blog/

Retirement Headwinds

 Do you ever dream of going to work, not because you have to, but because you want to? That’s the number one goal of most Americans over 40. But most financial gurus say that some of the headwinds facing the decision to retire are as daunting as ever.

Consider these Retirement Headwinds:

  • Low portfolio return expectations
    • Lower bond returns: Over time, bonds generally provide long-term returns similar to the coupon percentage they make (i.e. if the coupon of a bond is 5% and held to maturity, you will receive 5% annually until maturity if there is no default).  Interest rates on the 10 year treasury recently went below 1.7%.  This is the lowest yield on the 10 year Treasury in over 50 years.  Since most bond yields are positively correlated with the 10 year treasury, the argument could be made that all yields are lower than their historical average.  According to the Wall Street Journal, rates on the 10 year Treasury touched the lowest yields in modern history.
    • Lower than average stock returns: Historically the stock market (S&P 500) has traded at an average Price to Earnings ratio of 15, but has ranged between 7 and the low 30’s  (Price to Earnings, or P/E is the ratio of a company’s current share price compared to its per-share earnings)  .  Today the P/E is around 12.[i]  If the P/E is contracting (i.e. when the P/E shrinks), the price investors are willing to pay for the combined earnings of the companies trading in the market declines.  This usually results in a decline in the value of the stock market.  This is happening for a few reasons.  One economic study points to the Baby Boomers.  Baby Boomers are entering the stage of life when they generally need to be more conservative.  They may feel that it is no longer suitable to invest in the stock market.    This pool of money that has been added to over the last 30 years now needs to be used.  The largest segment of our population with a sizable amount of investment resources is likely being more cautious and, thus, selling more equities than they are purchasing.  You can read the full FRBSF economic letter here
  • Volatility: Markets may continue to move erratically, which tends to cause poor behavioral finance decisions (basically buying high and selling low). This is not new or necessarily worse than before, but still a major challenge for inexperienced investors and advisors.
  • Inflation: Higher inflation may be coming in many different ways.
  • High government debt: As a portion of GDP, government debts can kindle higher prices.
    • Currency devaluation: Low dollar value can cause resources to cost more.  For example, higher oil prices are likely the result of oil sales being denominated in U.S. dollars.
    • Health care costs: People are living longer due to advancements in medical and biomedical technology. Many don't realize the financial burden a few extra years will be for this generation, but it's expensive to be on those meds and have that 2nd hip replacement.
    • Increased tax rates – The debt will need to be paid by someone. You can see some of the new Pension taxes that where just pushed onto retirees in the state of Michigan last year. The extra 4.35% Pension tax adds up year after year. There are more tax hikes coming at the federal level next year, too.
  • Real median personal income: Adjusted for inflation 2010 dollars (as shown by Wikipedia using census data) are flat after inflation over the last 20 years - so it’s been difficult for the average American to save more without changing their lifestyle.

With all these headwinds, surely there are some tailwinds working in our favor? Well, even though I’m a “glass half full” kind of guy, I just don’t see any. So that means investors need to make adjustments to compensate for the headwinds. Coming up in my next blog, I’ll explain some ways to do that.


Bond prices and yields are subject to change based upon market conditions and availability. If bonds are sold prior to maturity, you may receive more or less than your initial investment. Holding bonds to term allows redemption at par value. The information contained in this report does not purport to be a complete description of the securities, markets, or developments referred to in this material. The information has been obtained from sources considered to be reliable, but we do not guarantee that the foregoing material is accurate or complete. Any opinions are those of Center for Financial Planning, Inc., and not necessarily those of RJFS or Raymond James. Past performance may not be indicative of future results. The opinions expressed in the FRBSF Economic Letter are those of the authors and not necessarily those of Raymond James. Diversification does not assure a profit or protect against loss.

 [1] Yahoo! Finance

Lessons in Delayed Gratification from a 4 year old

 On Easter morning my daughter, Lilly, who is 4 years old, awoke with great anticipation as every child does.  Knowing the Easter Bunny came the prior night, she ran downstairs to hunt for her basket and was thrilled to find it.  She turned to me and said, “Mommy the Easter Bunny left me a basket full of c-AN-dy,” stretching the word out for emphasis.  I know, I know, I’m not winning any parent of the year award by filling the basket with candy but, hey, it’s a special occasion.  So then she said, “Come on Mommy let’s go upstairs and lay out all of the candy and you can tell me about each one.”  So we did this and she didn’t even ask to eat a piece.  I was blown away!  When I asked if she wanted anything she said, “No I’ll wait until after breakfast when I can eat more than one piece of it without getting a belly ache,” which is often my reasoning when telling her she has to wait until after breakfast for a treat.  

Her Easter morning restraint reminded me of the study done on deferred gratification by a psychologist at Stanford in the late 1960’s.  Here’s a great YouTube of what came to be known as the Marshmallow experiment. In the experiment, each child was offered a marshmallow now or, if they could resist eating the marshmallow, they could receive two.  The children that participated were later studied to determine if this resulted in future success.  In fact, it did.   The children that waited showed higher SAT scores, had higher self-esteem, and weren’t so easily frustrated. 

Deferred gratification is a very important life lesson and one of the keys to financial success.  In order to meet future financial goals, something has to be given up today, but that doesn’t always have to be difficult.  Here are a few easy steps: 

  1. Avoid the temptation of spending money now, for example, not taking that extra vacation this year in order to make my Roth IRA contribution (which is still painful for me even though I know it is the right thing to do). 
  2. You need to find an alternative because you still have to make life worth living in the present.  So for me that ends up being a local “staycation” instead of that big vacation. 
  3. It is always important to focus on the reward, which in my case is hopefully a comfortable retirement, or in my daughter’s, lots of candy after breakfast. 

While I’d like to take credit for my superior parenting skills by pointing out my 4 year old grasps the concept of delayed gratification better than most adults, I don’t think I can.  That one she came up with all on her own.  And it is a lesson that we all need to incorporate into our lives to become better savers and investors.  


The information contained in this report does not purport to be a complete description of the securities, markets, or developments referred to in this material.  Any opinions are those of Center for Financial Planning, Inc., and not necessarily those of RJFS or Raymond James.

Saving for Tomorrow with TED Talks

If you haven’t heard of them before, TED Talks (TED stands for Technology, Entertainment, and Design) offer a wealth of inspiration and discussion points. As their tagline says, they truly have Ideas Worth Spreading. At The Center, we regularly discuss insightful TED video talks whether they offer thoughts on personal growth, practice management or investing.

One of my favorite TED Talks was recorded in November 2011 and featured Shlomo Benartzi. Benartzi is an economist in the field of behavioral finance and his work and studies seek to help improve an investor’s chances of saving to meet goals such as retirement. Anyone who thinks that they might need to save for the future – and that should encompass practically everyone – could benefit from viewing this video. 


The information has been obtained from sources considered to be reliable, but we do not guarantee that the foregoing material is accurate or complete. Any opinions are those of the speaker and not necessarily those of RJFS or Raymond James. Every investor’s situation is unique and you should consider your investment goals, risk tolerance, and time horizon before making any investment decision.

Active Investment Management

What do you believe?  We spend a lot of time discussing what we believe from an investment perspective; constantly challenging our assumptions all with the goal of constructing the most efficient portfolios to fund our clients’ most important financial goals. One of our firm’s core investment beliefs is that “Active management with skilled managers can beat passive indexes in full market cycles.” 

It is our contention that there are investment managers out there that CAN outperform the indexes AND that we have the capability to search them out. No small feat to be sure – but our firm’s 27 year history is helpful.  There are plenty of studies on both sides of the aisle in the active vs. passive debate. There are advantages and disadvantages to each style. Not surprisingly, the findings are usually consistent with how the author manages money. Proponents of a passive style often focus on the efficiency of markets and investment costs.  As you might expect, active managers (i.e., consultant) have higher costs over passive index investments.  Investment expenses are one of many criteria to consider when allocating capital between active and passive investments.  Most importantly, we focus on returns after all fees and expenses. 

We had a conversation amongst our investment committee recently – our question:  “Does a belief in active management imply that there is no place for a passive investment in any category under any circumstance?” I don’t think so.  As an active management proponent I can think of at least two circumstances where a passive investment might be appropriate.  

  • If we believe (based on research I would hope) that there is an asset class that is difficult for a manager to outperform.

OR

  • If we cannot find a manager that we have a high conviction in to outperform the index. 

If one of the two criteria is met then a passive choice might be appropriate. In the end, investment strategies and vehicles are merely a means to an end. The active vs. passive debate is sure to continue.  We believe that in most environments there are active managers available that provide value after all fees and expenses.


Any information is not a complete summary or statement of all available data necessary for making an investment decision and does not constitute a recommendation.  Any opinions are those of Center for Financial Planning, Inc., and not necessarily those of RJFS or Raymond James. Expressions or opinion are as of this date and are subject to change without notice.  Every investor’s situation is unique and you should consider your investment goals, risk tolerance and time horizon before making any investment.  Investing involves risk and you may incur a profit or loss regardless or strategy selected.

Invest Like a Woman

Face it, there are some things men tend to be better at and some things come easier to women.  Let’s take investing for example.  Studies have shown, time and again, that women make much better investors over the long-term than men*.    Two factors are at play here: risk and emotion

Investment decisions are often driven by emotion more so than anything else for individuals (and professionals too!)  And, sorry guys, but as I’m sure you are aware we women have written the book on emotional swings.  As such, we are more in tune with our emotions as we have to control these swings often.  Yes, I know it seems impossible that we are controlling our emotions but believe me, you’d hate to see us when these emotions run unchecked. 

Women tend to take fewer risks than men in many aspects of life.  Just look at my major injury history versus my husbands (not that I’m keeping score)

And that is only in the 16 years since I’ve known him! 

While taking less risk normally means less return, it does not always work out that way.

By using and managing our emotions instead of repressing them, like men stereotypically tend to, women may make better investment decisions. Because most women have fine-tuned (I’m not claiming perfected) our impulse control, we're more likely to resist overreacting which could lead to trading too much on the latest CNBC report, whether that be selling during market panics or jumping on the bandwagon too far into a rally.

I’d love to see these studies continuously revisited by the academics to see if this data holds true especially if we experience a much longer run to this bull market.  But for now it might be a good idea to get in touch with your feminine side!


*Inside the Investor’s Brain (Wiley Trading, 2007)

Boys will be boys: Gender, overconfidence, and common stock investing, by Brad M. Barber and Terrance Odean, The Quarterly Journal of Economics, February 2001.

The information contained in this report does not purport to be a complete description of the securities, markets, or developments referred to in this material. The information has been obtained from sources considered to be reliable, but we do not guarantee that the foregoing material is accurate or complete. Any information is not a complete summary or statement of all available data necessary for making an investment decision and does not constitute a recommendation. Any opinions are those of Angela Palacios and not necessarily those of RJFS or Raymond James. Expressions of opinion are as of this date and are subject to change without notice. Past performance is no guarantee of future results.

The Anxious Investor

Ripple effects from the global financial crisis and recession of 2008 are etched in our memory.  In a previous post, A Fear-Driven Investor, we discussed the tendencies investors display when decisions are driven by fear or greed.  When fearful investors can let go of what scares them about the market, the course evens. It’s not unlike letting go of fears in other areas of life. 

When I think of the fear-driven investor, I think about what happens to confidence and decision making when we feel worried and anxious. Have you ever tried doing anything when you are worried and anxious?  I think about the first time I went kayaking on Lake Huron with my sister. 

My sister was more expert than I.  I imagined a big, smooth pond and a sleek little kayak but I really had no idea what I was doing especially when the storm clouds blew in.  My idea of kayaking was to relax more and stay physically fit; however I was a bit fearful and anxious about tipping over when the waves got bigger!  

What happens to anxious kayakers?  I quickly found out! When your body is loose, you can move the boat and make adjustments.  When you get anxious and stiff, the boat becomes tippy and unstable. Once I understood how one decision affected another, I began to relax and I started doing much better.  

If you are driven by news rather than an investment plan, you may end up tipping your portfolio like I tipped my canoe. 

Want to avoid getting “wet”? Here are 3 tips for investors to help reduce anxiety and promote a smoother ride:

  • Set realistic expectations - Trying to refine the future to a point where you will never be surprised creates a headwind that is hard to overcome.
  • Understand the effect your financial decisions have on other financial issues - Focus on your own behavior, not the market’s behavior. 
  • Re-evaluate your investment plan periodicallySmall and consistent course corrections are just as important as the plan.

I still kayak on occasion, and I’m always reminding myself to stay relaxed and in the flow. It’s something I remind myself on a regular basis when planning investments as well. It’s much easier to keep your boat afloat when you loosen up, especially when the investment waters get choppy.


Any opinions are those of Center for Financial Planning, Inc., and not necessarily those of RJFS or Raymond James.  Investing involves risk, including risk of loss.

Tools of the Trade

Just as Luke Skywalker had his light saber and Emeril Lagasse his garlic (BAM!), the Investment Management business has…FI 360®?? 

Most investors have heard of Morningstar, which is a financial data provider that provides data on literally millions of different investments.  This is very widely used by the investment community for up-to-date data and financial analysis on a wide variety of investment instruments.  To a lesser degree, you may have even heard of Ibbotson Associates, recently acquired by Morningstar, which has data on portfolio construction and implementation.  

Most, however, even within our wealth management profession, have not heard of another tool we use called FI360®.  This company offers a full circle approach to investment fiduciary education and support. 

This software helps us with our fiduciary responsibility to monitor our investment managers on a regular basis and gives us a red flag if there is something to be concerned about. These are some of the factors FI360® reviews:

  • Manager Tenure – alerts us to recent leadership change
  • Composition of the portfolio – alerts us if the investment is taking a larger amount of risk in some aspect of the portfolio by greatly over- or underweighting something compared to other like investments
  • Expenses – alerts us to increased or higher than average expenses
  • 1, 3 and 5 year returns – alerts us if an investment is underperforming like investments over those periods of time. 

When looking at this information on a regular basis we can understand where we need to dig deeper to make sure the investment is in the best interest of our clients’ portfolios. It’s important to look often but not too often. Keeping an eye on short-term trends can obscure more meaningful long term data. For us, that means a semi-annual review of our recommended investments using FI360® analytics. 

Keeping on top of investments requires tools of the trade. We feel fortunate to have fi360 to get the job done and hope you find the proper tools to help you achieve investment success.  May the force be with you!


http://www.fi360.com/main/about.jsp