Investment Planning

Great Investment Performance is Not Enough

 "The economy is suffering" and "Job loss" and "Euro crisis" ... you've likely been reading a lot of bad news about the economy lately. Especially in this election season, the worst often gets pushed center stage in campaign ads and speeches. But instead of focusing on the buzz, take a look at the facts. Below is a chart of returns over the past year from 8/20/2011 to 8/21/2012.  The S&P 500 returned over 28% including dividends!!!

Source: Morningstar Direct

This has happened during a time when:

  • United States Treasuries lost their coveted AAA rating from S&P debt rating agency
  • National Unemployment remains high
  • The Euro Zone continues to be engulfed by concerns over debt

And that is just to name a few of the scary headlines we’ve witnessed over the past year. Regardless, though, the market continues to march on.

Unfortunately, the average investor has been divesting in the U.S. markets consistently since 2008 rather than investing. The chart below shows that the average retail investor (that is you and me), represented by the blue and orange areas, has been consistently pulling money out of US stocks while institutions, represented by the green area, have been consistently investing.

Source: Morningstar Direct

You might ask where has the money been going.

  • A large amount has been flowing into U.S. Bonds (despite the downgrade and historically low interest rates)
  • Some has left the market to pay down consumer debt
  • Many are moving over to exchange traded instruments to find their U.S. Stock exposure

It is hard to say if the average investor is permanently scared away from buying U.S. Stocks, but do not count on the media to make it feel any easier!


The information contained in this report does not purport to be a complete description of the securities, markets, or developments referred to in this material.  The information has been obtained from sources considered to be reliable, but we do not guarantee that the foregoing material is accurate or complete.  Any information is not a complete summary or statement of all available data necessary for making an investment decision and does not constitute a recommendation.  Any opinions are those of Center for Financial Planning, Inc., and not necessarily those of RJFS or Raymond James. The S&P 500 is an unmanaged index or the 500 widely held stocks that are generally considered representative of the U.S. stock market.  Inclusion of these indexes is for illustrative purposes only.  Keep in mind that individuals cannot invest directly in any index, and index performance does not include transaction costs or other fees, which will affect actual performance.  Individual investor’s results will vary.  Past performance does not guarantee future results.  Dividends are not guaranteed and must be authorized by the company’s board of directors.

Euro 101: Who’s In the Euro Zone and Why Was It Established?

 When you think of Europe, your mind might immediately start plotting your “bucket list” of vacation destinations. That happens whenever I see a map like the one below, but this picture actually brings us to the next lesson on Europe.  Could you imagine changing currencies every time you drove up to the Upper Peninsula or over to Chicago?  While we are somewhat used to that when we go over the bridge to Canada, most of the United States is not.  However, that is what living in Europe was like until 1999, when the Euro Zone was established.

Lesson #2

What is the Euro Zone?

In contrast to the European Union’s large membership of 27 countries, the Euro Zone consists of only 17 of those 27 countries.  This is an Economic and Monetary union of these countries.  They have all accepted the Euro as their sole legal currency.  The Euro Zone currently consists of Austria, Belgium, Cyprus, Estonia, Finland, France, Germany, Greece, Ireland, Italy, Luxembourg, Malta, the Netherlands, Portugal, Slovakia, Slovenia, and Spain.

According to the European Commission, the benefits of the euro are diverse and are felt on different scales, from individuals and businesses to whole economies. They include:

  • More choice and stable prices for consumers and citizens
  • Greater security and more opportunities for businesses and markets
  • Improved economic stability and growth (Okay, maybe this one is up for debate)
  • More integrated financial markets
  • A stronger presence for the EU in the global economy
  • A tangible sign of a European identity

The European Central Bank (ECB) was established to administer the Euro Zone.  The ECB controls monetary policy similar to our Federal Reserve Bank in the U.S.  Their main goal is to keep inflation under control by setting interest rates.  Lately they have had to become a buyer of member countries bonds in order to help bring their rates (borrowing costs) down for countries like Spain and Italy. 

I was fortunate enough to spend three years living in Germany after the Euro Zone was created.  We found ourselves traveling from Germany to other Eurozone countries for long weekends as easily as driving to Chicago for a visit.  If I felt this way as an individual, you can imagine the impact this has had for business.


The information has been obtained from sources considered to be reliable, but we do not guarantee that the foregoing material is accurate or complete.  Any opinions are those of Center for Financial Planning, Inc., and not necessarily those of RJFS or Raymond James.

Euro 101: A Little History Behind the Euro Zone Crisis

 With the Olympics in winding down, all eyes have been on Europe now for a change…oh wait…I guess we are already sick of hearing about Europe.  Well at least this was a welcome distraction from the now household name, Angela Merkel, and the European Debt debacle. 

I was recently at the Morningstar Conference in Chicago and had the privilege to listen to William James Adams PhD, an Economics’ professor at University of Michigan.  Professor Adams is known for his expertise on the European economy and its history.  He was the last speaker at the end of a three-day conference and many of the attendants remained to hear his presentation “How Fragile Is the Euro”.  I think this speaks to the appetite of everyone for information on the Euro Zone and what could potentially happen.  It is an area that we will all need to be well versed on in the coming months and years, if we aren’t already, in order navigate these investment waters.

In a part of his presentation, Professor Adams brushed us up on Europe 101. I think we all can benefit from revisiting the background of Europe in light of  the focus on the Euro’s end game.  In the coming weeks, I will attempt to present a brief history of the European Union, the Euro Zone and the policies that lead them to where they are today.  I hope you find this history lesson as valuable and refreshing as I have and, much like the Olympics, a welcome break from the endless Euro collapse headlines! 

Lesson #1:

What is the European Union?

The European Union began with the Treaty of Paris in 1951.  It is a system of government meant to establish diplomatic and economic stability originally between 6 countries, France, West Germany, Italy, Belgium, Luxembourg and the Netherlands.  It has since expanded to include 27 different countries speaking 23 different languages.  See the graphic below for the current members.

Source: en.wikipedia.org

You can also view an animated chart at http://en.wikipedia.org/wiki/File:EC-EU-enlargement_animation.gif showing the order of accession of the countries starting in 1957.


Links are being provided for information purposes only.  Raymond James is not affiliated with and does not endorse, authorize or sponsor any of the listed websites or their respective sponsors.  Raymond James is not responsible for the content of any website or the collection or use of information regarding any website’s users and/or members.

Around the Water Cooler at The Center

 We find ourselves in the middle of summer again and more than half way through the year.  Here at The Center, this is the time of year when we are digging into the most intense research and doing some very “deep thinking”. A heavy dose of conferences and speakers in the spring gave us much food for thought, and now we find ourselves at a time in the year where the schedule seems a bit lighter, no doubt due to our clients out enjoying their well-deserved summer vacations. So, while you may be thinking about relaxing, here’s what we’re thinking about at The Center:

  • Around the world, government intervention has caused interest rates to fall due to slowing growth in China and Euro Crisis. Can they go even lower?
  • A surprising slowdown in overall US debt growth has been occurring under our noses. No, the US federal debt load keeps growing, but there has been measurable deleveraging on the state and household levels.

  • The Affordable Care Act was largely upheld by the Supreme Court last month having implications for Americans and their investment and tax strategy in all walks of life.

  • Scandalous headlines are resurfacing at big banks, most recently JP Morgan and Barclays

This is more than water cooler talk for us, we are busy working these landmark changes into our strategies for the future. To find out more about what’s catching our attention, check out our Quarterly Investment Commentary.

Elections and the Markets: Landslide victories and divided governments

 While I was only in grade school at the time, many of you may remember the landslide victory of Ronald Reagan in 1984.  He not only won 59% of the popular vote, he also had the highest number of electoral votes (525) over Walter Mondale.  If you were lucky enough to be an investor at this time, you will remember this was the start of a strong bull market run for domestic stocks.  But are landslide victories always this good for investors? 

The short answer is “no,” but there have not been enough landslide victories to get a good sample set to draw conclusions.  The markets don’t necessarily like them because overwhelming victories by either party means the politician could have more power to invoke change and that could mean potentially higher economic policy risk resulting in higher inflation or interest rates on the horizon.

A divided government can alleviate much of this concern as it brings with it the benefits of legislative check and balances.  During Reagan’s era, Democrats controlled the House while Republicans were the majority in the Senate for 6 of his 8 years as President. All parties had to work together to create the successful policies like the 25% across the board tax reduction, deregulation and corporate tax cuts that stimulated the economy and markets onward and upward.

So how does this play out in the 2012 election?  It may feel like the election is close, but consider that the GOP still hasn’t officially nominated a candidate.  Polls tend to favor Obama against presumptive nominee Mitt Romney, but there are still four important months left of campaigning.  It doesn’t appear, at this point in the race, as though a win will be a Reagan-like landslide.  What it will mean for the markets remains as much of a mystery as which candidate will win on November 6th.

Source: FederatedInvestors.com


The information has been obtained from sources considered to be reliable, but we do not guarantee that the foregoing material is accurate or complete.  Any information is not a complete summary or statement of all available data necessary for making an investment decision and does not constitute a recommendation.  Any opinions are those of RJFS or Raymond James.  Past performance may not be indicative of future results.

Elections and the Markets: Better returns on the horizon?

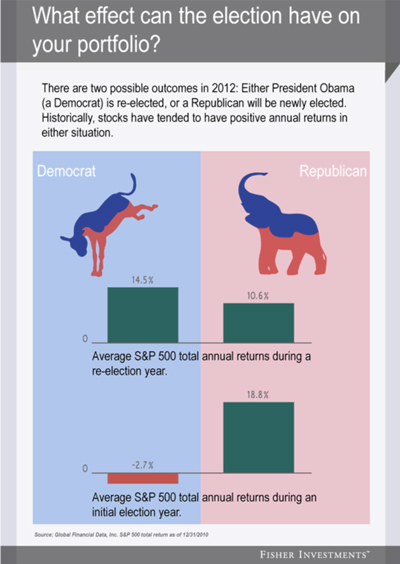
 In 2012, we either re-elect a Democrat or newly elect a Republican—history shows either can be a sweet spot for stocks. Stocks have averaged 14.5% historically in election years a Democrat is re-elected and 18.8% when a Republican is newly elected.

Source: Global Financial Data, Inc. S&P total return as of 12/31/10

When looking at the above returns, it may be hard to believe that we could end up with those kinds of returns by the end of the year … especially with the strong pullback we have seen recently.  In light of this recent pullback in the markets, both domestically and internationally, it is important to revisit a chart we have shared before.  It serves as an important reminder of the volatility experienced each year and the returns that investors end up having the potential to earn despite these pullbacks.

Of course you have no control over the market’s ups and downs or who gets elected, aside from your vote, to serve as the President of the United States, but you can be better prepared to weather these volatile cycles if you focus on factors you can control like staying fully invested.


The S&P 500 is an unmanaged index of 500 widely held stocks that are generally considered representative of the U.S. stock market.  Inclusion of this index is for illustrative purposes only.  Keep in mind that individuals cannot invest directly in any index, and individual investor’s results will vary.  Past performance does not guarantee future results.  The information contained in this report does not purport to be a complete description of the securities, markets, or developments referred to in this material.  Any information is not a complete summary or statement of all available data necessary for making an investment decision and does not constitute a recommendation.  Any opinions are those of Center for Financial Planning, Inc., and not necessarily those of RJFS or Raymond James.

Elections and the Markets: What have you done for me lately?

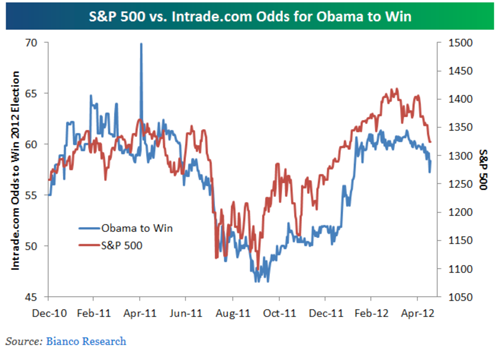
 It’s not just a catchy Janet Jackson song, it’s a question many voters are going to be asking of the President when they head to the polls this November.  One indicator that seems to be more effective than any campaign ad for voters is the stock market. The chart below shows just how highly correlated the odds are that Obama is going to win (based on voter polling from Intrade.com) with the S&P 500.  The higher the S&P come voting time, the more likely he should be to win the election.


In a study done by John Nofsinger, "The Stock Market and Political Cycles," which was published in The Journal of Socio-Economics in 2007, Nofsinger proposed that the stock market may be able to predict which candidate will be elected. He analyzed the relationship between the social mood of the country and the presidential election and concluded that when the country is optimistic about the future, the stock market tends to be high and voters are more likely to vote for those in power. When the social mood is pessimistic, the market is low and people tend to vote out the incumbent and put a new party in power.  

So, while Janet Jackson had relationships in mind rather than elections when she helped write the song, “What Have You Done for Me Lately”, if you can look past those mid-1980’s shoulder pads and frizzy hair, you can find she hits a chord when it comes to how we elect the leaders of our country!


The information contained in this report does not purport to be a complete description of the securities, markets, or developments referred to in this material.  The information has been obtained from sources considered to be reliable, but we do not guarantee that the foregoing material is accurate or complete.  Any information is not a complete summary or statement of all available data necessary for making an investment decision and does not constitute a recommendation.  Any opinions are those of Center for Financial Planning, Inc., and not necessarily those of RJFS or Raymond James.  Past performance may not be indicative of future results.  You cannot invest directly in an index.

Links are being provided for information purposes only.  Raymond James is not affiliated with and does not endorse, authorize or sponsor any of the listed websites or their respective sponsors.  Raymond James is not responsible for the content of any website or the collection or use of information regarding any website’s users and/or members.

Elections and the Market

 It's election season…again!  While the mudslinging between candidates and special interest groups ramps up, how will the stock markets react? 

History suggests that investors can benefit from paying attention to the presidential election cycle.  Yale Hirsch, a stock market historian and the creator of the Stock Trader’s Almanac, has developed the presidential election cycle theory.  This study, among others, supports evidence that there is a significant relationship between the presidential cycle and the stock market.  

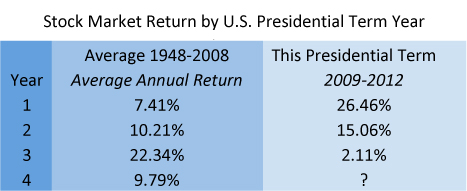
Here is what returns look like on the average election cycle verses our current election cycle:

Source: S&P500 Total Return Index

Year 1: The Post-Election Year
Of the four years in a presidential cycle, the first-year performance of the stock market, on average, is the worst; however, so far with the current administration, it has been the best. We recovered sharply immediately following the financial crisis of 2008.

Year 2: The Midterm Election Year
The second year, although historically better than the first, this time has trailed the strong performance of the first year.

Year 3: The Pre-Presidential Election Year
The third year (the year proceeding the election year) is the strongest on average of the four years, but with the European concerns, ended up being the worst of the cycle so far.

Year 4: The Election Year
In the fourth year of the presidential term and the election year, the stock market's performance tends to be above the overall average.

While the current cycle seems to be turned on its head, it is still worth exploring different election scenarios and how they affect the markets.

  • What if a Democrat wins? What if a Republican wins?
  • What if the race is close? What if it is a landslide?
  • Can the stock market predict an election winner?

While the candidates are busy posturing for the election, we will explore some scenarios and how to posture your portfolio accordingly in the coming weeks.


The S&P 500 is an unmanaged index of 500 widely held stocks that’s generally considered representative of the U.S. stock market.  Keep in mind that individuals cannot invest directly in any index, and individual investor’s results will vary.  Past performance does not guarantee future results.  The information contained in this report does not purport to be a complete description of the securities, markets, or developments referred to in this material.  The information contained in this report does not purport to be a complete description of the securities, markets, or developments referred to in this material.  The information has been obtained from sources considered to be reliable, but we do not guarantee that the foregoing material is accurate or complete.  Any information is not a complete summary or statement of all available data necessary for making an investment decision and does not constitute a recommendation.  Any opinions are those of Center for Financial Planning, Inc., and not necessarily those of RJFS or Raymond James.

Sell in May and Go Away

 Along with the warm weather, spring always brings about the old debate of whether it is a good idea to, “Sell in May and go away.”  Markets tend to have their stronger performance between October and May, which has certainly held true in the past year. 

There are many theories as to why this could be true:           

  • Investors tend to fund their IRA accounts either early or later in the year
  • Lower summer productivity for business
  • And the most obvious, people prefer to be outside rather than inside investing their money
    (especially in Michigan).

However, this year could be different. If you look at monthly returns in Election years (which like it or not we are in the middle of) the above picture is contradicted.

Beware of strategies involved in short-term timing of the markets.  Many investors end up hurting themselves by trying to time their investments in and out of the market.


Source:  The Big Picture  http://www.ritholtz.com/blog/

Retirement Headwinds

 Do you ever dream of going to work, not because you have to, but because you want to? That’s the number one goal of most Americans over 40. But most financial gurus say that some of the headwinds facing the decision to retire are as daunting as ever.

Consider these Retirement Headwinds:

  • Low portfolio return expectations
    • Lower bond returns: Over time, bonds generally provide long-term returns similar to the coupon percentage they make (i.e. if the coupon of a bond is 5% and held to maturity, you will receive 5% annually until maturity if there is no default).  Interest rates on the 10 year treasury recently went below 1.7%.  This is the lowest yield on the 10 year Treasury in over 50 years.  Since most bond yields are positively correlated with the 10 year treasury, the argument could be made that all yields are lower than their historical average.  According to the Wall Street Journal, rates on the 10 year Treasury touched the lowest yields in modern history.
    • Lower than average stock returns: Historically the stock market (S&P 500) has traded at an average Price to Earnings ratio of 15, but has ranged between 7 and the low 30’s  (Price to Earnings, or P/E is the ratio of a company’s current share price compared to its per-share earnings)  .  Today the P/E is around 12.[i]  If the P/E is contracting (i.e. when the P/E shrinks), the price investors are willing to pay for the combined earnings of the companies trading in the market declines.  This usually results in a decline in the value of the stock market.  This is happening for a few reasons.  One economic study points to the Baby Boomers.  Baby Boomers are entering the stage of life when they generally need to be more conservative.  They may feel that it is no longer suitable to invest in the stock market.    This pool of money that has been added to over the last 30 years now needs to be used.  The largest segment of our population with a sizable amount of investment resources is likely being more cautious and, thus, selling more equities than they are purchasing.  You can read the full FRBSF economic letter here
  • Volatility: Markets may continue to move erratically, which tends to cause poor behavioral finance decisions (basically buying high and selling low). This is not new or necessarily worse than before, but still a major challenge for inexperienced investors and advisors.
  • Inflation: Higher inflation may be coming in many different ways.
  • High government debt: As a portion of GDP, government debts can kindle higher prices.
    • Currency devaluation: Low dollar value can cause resources to cost more.  For example, higher oil prices are likely the result of oil sales being denominated in U.S. dollars.
    • Health care costs: People are living longer due to advancements in medical and biomedical technology. Many don't realize the financial burden a few extra years will be for this generation, but it's expensive to be on those meds and have that 2nd hip replacement.
    • Increased tax rates – The debt will need to be paid by someone. You can see some of the new Pension taxes that where just pushed onto retirees in the state of Michigan last year. The extra 4.35% Pension tax adds up year after year. There are more tax hikes coming at the federal level next year, too.
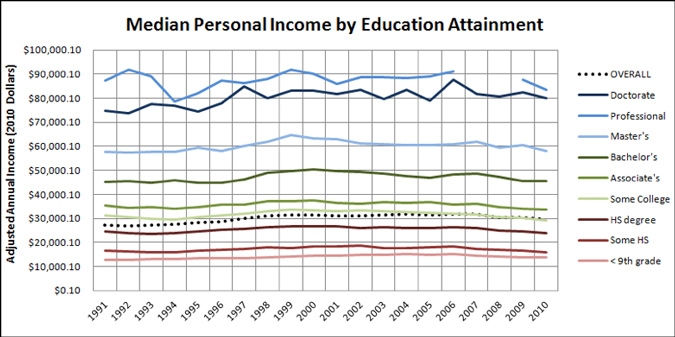
  • Real median personal income: Adjusted for inflation 2010 dollars (as shown by Wikipedia using census data) are flat after inflation over the last 20 years - so it’s been difficult for the average American to save more without changing their lifestyle.

With all these headwinds, surely there are some tailwinds working in our favor? Well, even though I’m a “glass half full” kind of guy, I just don’t see any. So that means investors need to make adjustments to compensate for the headwinds. Coming up in my next blog, I’ll explain some ways to do that.


Bond prices and yields are subject to change based upon market conditions and availability. If bonds are sold prior to maturity, you may receive more or less than your initial investment. Holding bonds to term allows redemption at par value. The information contained in this report does not purport to be a complete description of the securities, markets, or developments referred to in this material. The information has been obtained from sources considered to be reliable, but we do not guarantee that the foregoing material is accurate or complete. Any opinions are those of Center for Financial Planning, Inc., and not necessarily those of RJFS or Raymond James. Past performance may not be indicative of future results. The opinions expressed in the FRBSF Economic Letter are those of the authors and not necessarily those of Raymond James. Diversification does not assure a profit or protect against loss.

 [1] Yahoo! Finance