Investment Planning

Parents and Children Misaligned on Finances

 As the mother of a teen and a pre-teen, I can testify that parents and children often speak different languages. Like when my daughter says "I'm going to die," it doesn't generally mean she's seriously ill; it more likely means she got a hole in her favorite pants! I live for the promise of the day when my children are grown and we will be able to communicate on the same plane.  After reading the recent Intra-Family Generations Study conducted by Fidelity Investments, I’m not so sure that will ever happen…at least when it comes to finances.

The Intra Family Generations Study found that parents and their adult children are on different pages when it comes to several key family financial issues, including retirement planning, inheritance planning, and caring for elderly parents.  The study found that 97% of parents and children surveyed disagreed on whether adult children will care for their elderly parents if they need long term care assistance.  Children tend to overestimate the value of their parents’ assets (by an average of $100,000 or more) and parents are overly critical of their children’s financial decisions.  In addition, while 24% of adult children surveyed say they will need to help their parents in retirement, 97% of parents say they won’t need help.  Clearly, there are misunderstandings between the generations.

So why, you might ask, are adult children and parents so disconnected?  According to the study, (which I can vouch for in my personal experience) families simply don’t talk about financial issues.  Talking about things like investments, debts, savings shortfalls, income taxes, or estate planning is taboo in many families. 

Most interestingly, the study did find that 60% of adult children and 68% of parents indicated that they would be more comfortable discussing these important financial issues with a third party financial professional than with each other.  Financial planners are the ideal financial professionals to lead productive family meetings.

If you find yourself as either a parent who has not discussed future financial issues with your adult children or as an adult child who has not discussed long term care or financial issues with your parent, contact your financial planner to schedule your family meeting today.

Sandra Adams, CFP® is a Financial Planner at Center for Financial Planning, Inc. Sandy specializes in Elder Care Financial Planning and is a frequent speaker on related topics. In 2012 and 2013, Sandy was named to the Five Star Wealth Managers list in Detroit Hour magazine. In addition to her frequent contributions to Money Centered, she is regularly quoted in national media publications such as The Wall Street Journal, Research Magazine and Journal of Financial Planning.


Five Star Award is based on advisor being credentialed as an investment advisory representative (IAR), a FINRA registered representative, a CPA or a licensed attorney, including education and professional designations, actively employed in the industry for five years, favorable regulatory and complaint history review, fulfillment of firm review based on internal firm standards, accepting new clients, one- and five-year client retention rates, non-institutional discretionary and/or non-discretionary client assets administered, number of client households served.

Any opinions are those of Center for Financial Planning, Inc., and not necessarily those of RJFS or Raymond James.  Links are being provided for information purposes only.  Raymond James is not affiliated with and does not endorse, authorize or sponsor any of the listed websites or their respective sponsors. Raymond James is not responsible for the content of any website or the collection or use of information regarding any websites users and/or members.

The Earnings Upset

 My husband, brother-in-law and friends will never forget one Saturday afternoon spent at “The Big House”.  University of Michigan was playing Toledo and was expected to win by a large margin as they usually did against their regional MAC opponents.  I remember this particular game because they had much-coveted press box seats and sideline passes that my brother-in-law acquired in a charity auction.  They were expecting more excitement from the prestige of visiting the sidelines and sitting in the press box than from the game.  Little did they know what was in store that day.  For the first time ever Michigan lost to a MAC team with a score of 13-10!

The fourth quarter 2012 earnings season started much like the fans’ attitudes for Toledo before this game.  People were dismissing it as a lost quarter and game before it even began.  After Hurricane Sandy and the Fiscal Cliff debacle, many thought earnings would be a bust before they were even reported.  However, a little more than half way through corporate earnings releases, stocks are soaring for the year (at least as of writing this) and earnings are looking half-way decent.

  • Revenue Growth has been solid, up 3.3% so far.  Cost cutting continues to be the name of the game here.  70% of companies that have reported have beaten revenue forecasts, which are above average (66%).
  • Demand from emerging markets has fueled growth at large multinational companies.
  • A Narrowing Trade Deficit for the fourth quarter as reported by the U.S. Commerce Department means we are exporting more and importing less. This keeps more dollars in the U.S. and has also helped boost corporate earnings.

So, while positive earnings are usually the earliest released, it still should be a very decent show for corporate earnings for the end of last year.  Luckily for investors and the University of Toledo critics they now understand, “That’s why we play the game.”  As for my husband and his friends, they did enjoy the excitement of watching kick-off from the sidelines and the free snacks in the press box, if not a Michigan win!

http://www.usatoday.com/story/money/2013/02/06/corporate-profit-investors-earnings/1896885/

Angela Palacios, CFP®is the Portfolio Manager at Center for Financial Planning, Inc. Angela specializes in Investment and Macro economic research. She is a frequent contributor to Money Centered as well asinvestment updates at The Center.


Links are being provided for information purposes only.  Raymond James is not affiliated with and does not endorse, authorize or sponsor any of the listed websites or their respective sponsors.  Raymond James is not responsible for the content of any website or the collection or use of information regarding any website’s users and/or members.  The information contained in this report does not purport to be a complete description of the securities, markets or developments referred to in this material.

The information has been obtained from sources considered to be reliable, but we do not guarantee that the foregoing material is accurate or complete.  Any information is not a complete summary or statement of all available data necessary for making an investment decision and does not constitute a recommendation. Any opinions are those of the authors and not necessarily those of Raymond James.  Investing involves risk and investors may incur a profit or a loss.  Investing in emerging markets can be riskier than investing in well-established foreign markets.  The S&P 500 is an unmanaged index of 500 widely held stocks that is generally considered representative of the U.S. stock market.  Keep in mind that individuals cannot invest directly in any index and index performance does not include transaction costs or other fees, which will affect actual investment performance.  Individual investor’s results will vary.  Past performance does not guarantee future results.

Helping Clients with Asset Allocation

 In most books that discuss asset allocation, the author will mention at some point the relevance of strategic asset allocation and it being a prominent component to the investor’s outcome, which is typically measured in volatility and return.   At the Center for Financial Planning one of our core investment beliefs works with strategic asset allocation.  We believe there is an appropriate mix of assets that can help investors pursue their personal set of goals during volatile market conditions.  

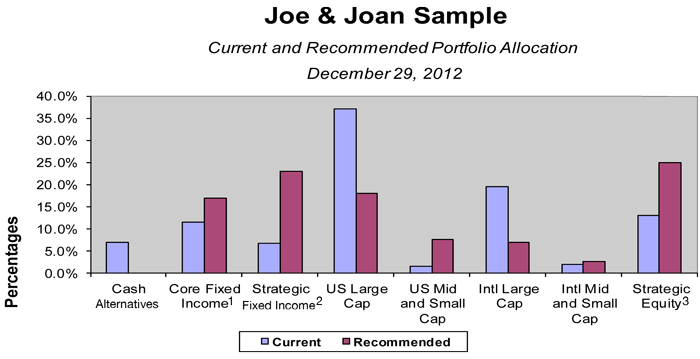
Below is a chart of a new client that recently came in for a financial plan overhaul.  You can see they had quite a difference in their current allocation to that of our recommended strategic allocation.  The current allocation in blue is overweight US Large Cap stocks and International Large Cap stocks while underweight in some of the more non-correlated assets like Strategic Income and Strategic Equity.  We were able to look over their outside investments in 401k’s, and 403b’s to help obtain what we determined to be a suitable mix, designed to keep them within their volatility comfort range as well as on track to reach their return expectations over the long haul.


These asset allocations are presented only as examples and are not intended as investment advice. Actual investor results will vary. Prior to making an investment decision, please consult with your financial advisor about your individual situation. Although derived from information which we believe to be reliable, we cannot guarantee the completeness or accuracy of the information above. Any information is not a complete summary or statement of all available data necessary for making an investment decision and does not constitute a recommendation. Investments mentioned may not be suitable for all investors. Any opinions are those of Matthew Cope and not necessarily those of RJFS or Raymond James. Investing involved risk and asset allocation does not ensure a profit or protect against a loss.
1. Core Fixed Income includes: U.S. Government bonds and high quality corporates
2. Strategic Fixed income includes: Non U.S. bonds, TIPS, less than high quality corporates and other bonds not in core fixed.
3. Strategic Equity includes: Hybrid managers, REITS, hedgeing strategies, commodities, etc.

5 Charts We are Thinking About

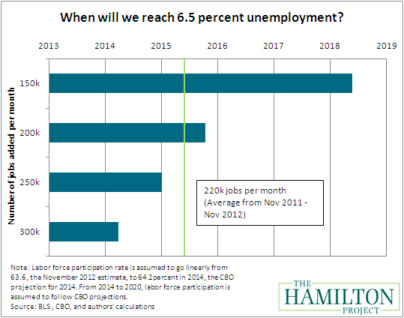
 In December the Federal Reserve (FED) announced yet another round of Quantitative Easing (QE) as Operation Twist was coming to an end. Through QE 4 the government will purchase $45 Billion in US Treasuries…every month…until unemployment comes down to 6.5%.  So we were wondering how long this could take.  The following chart lays out some scenarios.  At the current pace jobs are being added to the economy, it should take until mid-2015.

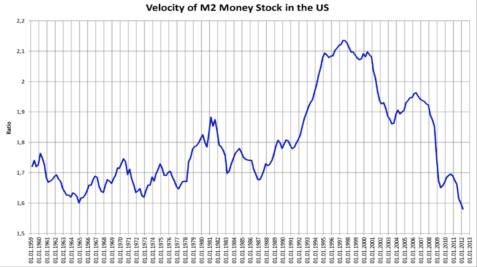
Despite all of the money the FED has been pumping into the economy the Velocity of that money has continued to slow.  Velocity means simply the rate the money is spent.  Following is a simple example of money velocity:

  • In a year I am paid $100 for going to work
  • I turn around and spend $50 to get my clothing dry-cleaned
  • Then my dry cleaner spends $30 of those dollars to buy food

The $100 in the economy was actually used to purchase $180 of goods and services over a year.  Therefore, the velocity is 1.8 ($180/$100).  Velocity of money is significant because we won’t likely see inflation in the economy until this picks up from the current record low levels over the past 50 years.

Source: Federal Reserve Bank of St. Louis

Note:  M2 Money Supply is a measure of the total money supply.  M2 includes everything in M1 and also savings and other time deposits.

Since money is not being spent with any speed, people must be saving.  Savings have increased dramatically for individuals in the U.S. as interest rates on personal savings accounts and money markets have been plummenting.  Many have moved from equities into bonds at record rates as bond rates have reached record lows.  Overall, according to the chart below, people are saving more but fewer are investing in financial markets and investing in savings accounts instead.  As you can see in the chart below the increase in percent of savings flowing into Money Markets rose from 29 to 61% over the past 4 years while the amount invested in financial markets has come down from 71 to 39% of total savings.  If investors turn a corner and start to regain faith in the financial markets, money might start flowing back that way.  This could create long-term tailwinds for stock and/or bond markets.

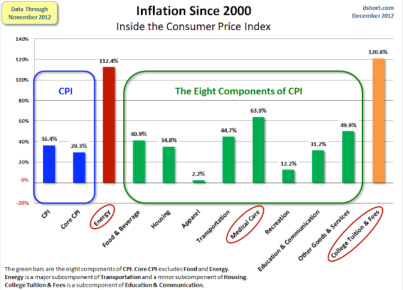
The chart below shows total Inflation over the past 12 years.  For example, College tuition and fees have gone up 120.8% in the last 12 years, if a college charge $6,000 per year in 2000 to attend now it would charge $13,250!  So if inflation is similar over the next 12 years how are we supposed to keep up with rising prices while earning less than .25% on our savings accounts meaning that same $6,000 invested at .25% over 12 years compounded annually will give us a meager $6,182?

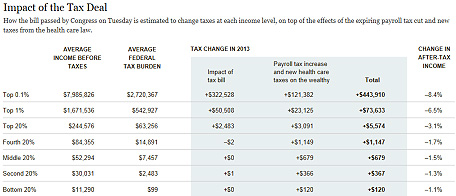
Lastly, taxes are on everyone’s mind.  On January 2nd a bill passed that will impact what everyone owes this year.  I found the table below to be a helpful summary of the impact of this bill.  For example, someone making around $85,000 per year will pay $1,147 more in taxes in 2013 than they paid in 2012.

Source: The New York Times

We use this data and more to help shape the direction our investments and financial planning recommendations for clients take over the coming years.


The information has been obtained from sources considered to be reliable, but we do not guarantee that the foregoing material is accurate or complete.  Any information is not a complete summary or statement of all available data necessary for making an investment decision and does not constitute a recommendation.  Any opinions are those of Center for Financial Planning, Inc., and not necessarily those of RJFS or Raymond James.

4 Things Corporations Can Do With Their Cash

 After a few very profitable years, many corporations have record amounts of cash on hand.  Wouldn’t this be a nice problem?  I have yet to experience this but feel I am up for the challenge.  I always have an idea of what I could do with extra money...a cute pair of shoes, turn my bathroom into a Tuscan escape, or even set foot on Antarctica.  I could go on for days.  Publicly traded Corporations, on the other hand, have a much more limited list of what they can do with extra cash on the books.  They can:

  1. Invest in their own securities through stock buyback programs
  2. Invest in capital, Research and Development, or hire more employees
  3. Acquire other companies
  4. Return the money to shareholders in the form of dividends

The first point is one I would like to dwell on.  Generally, when stock buybacks are announced, investors assume that this will automatically add value to the stock price.  This is logical, fewer shares outstanding means that the remaining shares own a larger slice of the company.  However, this is not always the case.  Often repurchased shares go right back out as part of compensation packages.  Also companies don’t always complete share repurchase programs if they need to use the cash in another way.

The irony is companies are usually flush with cash after business has been booming for a couple years or longer and after their stock prices have already jumped substantially.  This is when they tend to go on their shopping sprees.  When prices are down, in the midst of a crisis like early 2009, companies usually hold on to any cash they may have left, fearfully, rather than taking advantage of short-term depressions in their stock prices. 

David Zion an analyst and accountant for Credit Suisse came out with an excellent report on many stock buybacks over the past decade.  It shows that corporations are just as prone to poor investment behavior with their cash as many investors (maybe even worse).  Looking at one of the largest buyback programs over the eight years of the study, according to the Credit Suisse report, Hewlett Packard (HPQ) averaged an annualized loss of 11.3%!

Many experts are postulating that an increase in dividend taxes, which may occur next year, could lead to an increase in corporate stock buybacks (capital gains could be taxed at a much lower rate than dividends).  Be very skeptical, though, since stock buybacks are no guarantee of generating capital gains!


The information contained in this report does not purport to be a complete description of the securities, markets, or developments referred to in this material.  The information has been obtained from sources considered to be reliable, but we do not guarantee that the foregoing materials are accurate or complete.  Any opinions are those of Center for Financial Planning, Inc., and not necessarily of RJFS or Raymond James.  Raymond James Financial Services, Inc., Its affiliates, officers, directors or branch offices may in the normal course of business have a position in securities mentioned in this report.  This information is not intended as a solicitation or an offer to buy or sell any security referred to herein.  As of 12/5/12 close, HPQ was trading at $13.82/share.  HPQ is not closely followed by Raymond James Research.

What Better than the Gift of Financial Education and Support?

 I don’t know about you, but I can hardly believe that it is already time for the holidays.  It seems like just yesterday that I was racking my brain to come up with creative gift giving ideas for all of those people on my list.  I find that it is just as hard to find gifts for adults as it is for children.  But there is one gift I’ve found that transcends generations – the gift of financial education. 

I know, financial education does not sound as attractive or exciting as say, an iPad or a Wine of the Month Club membership, but it is a gift that can keep on giving for a lifetime.  What am I talking about when I suggest a gift of financial education?  Here are just a few ideas:

For Younger  Kids (elementary – high school):

  • If you’re trying to stay away from more electronics, there are hundreds of books, workbooks and other resources available from Jump$tart Coalition (JumpStart.org)
  • Games like Monopoly, The Game of Life, and PayDay are great (Most are available as both traditional board games or for the computer, Wii, etc.)
  • Make a contribution to a 529 College Education fund to support the child’s future education.

For Older Kids (college - young adults):

  • If your gift recipient has had earned income during the year, consider contributing to a ROTH IRA in their name. 
  • Gift shares of a mutual fund or stock introduce them to investing and help them start an investment portfolio.
  • Make a payment towards their outstanding student loan debt.

For Young Adults and Beyond:

  • Fund a year of a credit monitoring service to protect their credit and financial identity from fraud.
  • Purchase financial software to help them with budgeting and financial tracking (i.e. Quicken)
  • Pay for a consultation with a Certified Financial Planner ™ (my personal favorite!).  This can help provide basic financial education and guidance for getting them set on the right financial path.

Giving a gift tied to financial education and support may not make you the hero of the holidays, but you can be certain that the gift will long be remembered as one that lasted long after the holiday decorations are put away for another year.


Any opinions are those of Center for Financial Planning, Inc., and not necessarily those of RJFS or Raymond James.  Investments mentioned may not be suitable for all investors.

The Seasons of the Markets

 One of the Center’s Core investment beliefs is in “Market Cycles and Risk”. Before I explain our approach, I think it’s essential to remember that just about everything is cyclical.  There’s little I’m certain of but I do know this: Nothing goes in one direction forever.  Trees don’t grow to the sky. And there are few things as dangerous for investor health as insistence on extrapolating today’s events in the future.

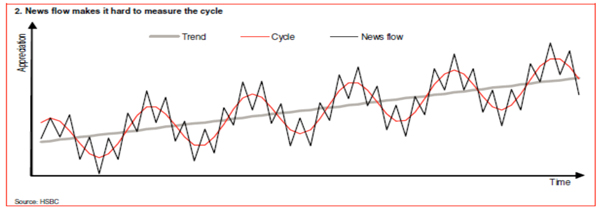
(Above is a sample chart of cycles with a discernible trend over time)

Our lives are full of different types of cycles.  There are those that occur naturally, like the cycle of life and those cycles that are biologically driven. There are also manmade cycles like the presidential cycle and the workweek cycle.  Ever wonder where we are in the current economic cycle or market cycle? Economic and market cycles are not quite as spherical, but they have different seasons and they do typically rotate in a circular fashion over time.

Below is a graph of the market cycle. The Pink/Purple is the fall at the top is fall, the Red is winter and the capitulation and bottoming process, Green represents the spring a thawing out of a new bull market, and Blue is the summer representing the bull market.  Luckily, in the seasons of the market, summer is usually 2-3 times longer than winter, same with contraction and expansionary periods in the economy.  

Very few people can consistently pick bottoms of markets within months and even fewer can pick market tops with any accuracy. Some of the best investment strategists make predictions that are years off the mark. But understanding the season is something that we try to do at the Center.  In our approach, we attempt to manage the exposure to equities during the late fall and early winter as some inevitable downturns can get very difficult for investors.  However, we also attempt to get back to normal allocations in the late winter and early spring.  We call this rebalancing and tactical asset allocation of a portfolio.  Adding to underweighted asset classes can be emotionally difficult for most investors to do during the winter and spring season when it seems like things in the world are falling apart. 

Most people would guess that we are currently in the summer or fall of the current economic cycle.  That’s when investors are comfortable, more at ease with a sense of relief and even optimism and excitement can prevail.  However, this cycle will end and again we will find ourselves with a different season where markets are uncomfortable and statements are not as cheery.   Another winter will be looking us in the face again.   Try to remember what was going on both internally (your stomach) and externally (the newspaper, fundamentals and technical indicators) in the last trough and it can help with the next one.  Because it’s in the winter that opportunity exists, you just have to remember it doesn’t always feel like opportunity. 


The information contained in this report does not purport to be a complete description of the securities, markets or developments referred to in this material.  The information has been obtained from sources considered to be reliable, but we do not guarantee that the foregoing material is accurate or complete.  Any information is not a complete summary or statement of all available data necessary for making an investment decision and does not constitute a recommendation.  Any opinions are those of Center for Financial Planning and not necessarily those of RJFS or Raymond James.  Investing involves risk and investors may incur a profit or a loss.  Past performance may not be indicative of future results.

Euro 101: Will the Euro Survive?

 This is the million-dollar question of recent history.  There is no clear-cut answer but William James Adams PhD, professor and expert on the European economy, thinks the Euro may survive.  There are two major opposing viewpoints to this question.  The first is the “Anglo-Saxon View” and second is the Continental Theory.

Anglo-Saxon View

This view is based on optimal currency area theory and examines whether or not an area would benefit from a common currency.  In order for a common currency to work, there must be at least one of the following tools available to the people:

  1. Labor mobility – Since there are major cultural differences and language barriers mobility, or the opportunity to move where the jobs are, between European countries is severely lacking for employees.
  2. Price and wage flexibility – Prices are very sticky, for example companies can’t just double the price of pasta because customers will simply buy something else instead.
  3. Transfer of tax revenues from one region to the other – This works in the U.S because the Federal government takes in $162 of tax revenue of every $100 in state tax revenue, so there is a lot to spread around as they see fit. In contrast, in Europe, the European Union only has $3 in revenue for every $100 of country revenue.

Supporters of the Anglo-Saxon view, feel that the currency has been doomed from the start. 

The Continental View

When the U.S. dollar came about, none of the above scenarios were in place for almost 150 years and yet the dollar survived.  This is the argument that proponents of the Continental View take.

These days, countries making a trade across borders of member nations, say from Germany to Spain, benefit greatly from the elimination of transaction costs and hedging of currency conversions that previously occurred.  Also, if the Euro didn’t exist, a deflationary bias could occur, which would hurt the sale of goods.  This happens when member nations start to adjust their interest rates to be more competitive and attract more investment money.

Ultimately, it is not in any country’s best interest to let the Euro collapse since they depend on exports to other European Union countries for their livelihoods.  As there is no clear cut answer, it will be interesting to continue to follow the developments across the Atlantic Ocean.  We are continually monitoring the situation in light of how this may impact our client’s portfolio. For more detailed information on how the Euro Zone crisis began, take a look at the other blogs in our Euro 101 series.

Please see the rest of the posts in our Euro 101 Series:

Lesson 1: A Little History Behind the Euro Zone Crisis

Lesson 2: Who’s in the Euro Zone and Why Was It Established?

Lesson 3: The Beginning of the End

Lesson 4:  Scandals


The information contained in this report does not purport to be a complete description of the securities, markets or developments referred to in this material.  The information has been obtained from sources considered to be reliable, but we do not guarantee that the foregoing material is accurate or complete.  Any information is not a complete summary or statement of all available data necessary for making an investment decision and does not constitute a recommendation.  Any opinions are those of Center for Financial Planning, Inc., and not necessarily those of RJFS or Raymond James.  Expressions of opinion are as of this date and are subject to change without notice.

Euro 101: Scandals

 What does the country of Greece have in common with companies like Enron, WorldCom and Tyco International?  The answer: Accounting scandals of epic proportions! 

History Lesson 4

In 1992 the creation of the Maastricht Treaty required all members of the Eurozone to limit their Deficit spending and total debt levels in relation to their Gross Domestic Product (GDP), laying the groundwork for later establishment of the Euro as a common currency.  The parameters for Government finance are:

  1. The yearly deficit that the individual country runs may not exceed 3% of the annual GDP of the country.  Exceptions to this must be approved.
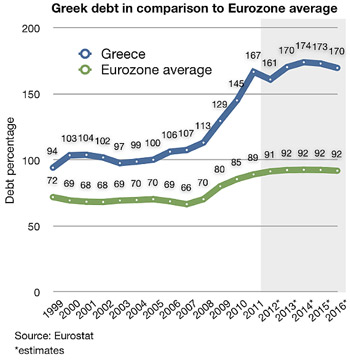
  2. Government Debt as a percent of GDP must not exceed 60%; however, there are only a couple of Eurozone countries that meet this criteria now.  As a whole the Eurozone countries average over 90% as shown in the chart below. 

Because of these requirements, countries like Greece (who far exceeds the 60 % acceptable level at 161% Debt to GDP) and Italy got more creative with their accounting methods and ignored internationally agreed upon standards in order to stay part of the Eurozone and use the Euro as their currency.  Leaders masked their deficit and debt levels through a combination of techniques, including inconsistent accounting, off-balance-sheet transactions (like leaving out large military expenditures or billions in hospital debt) as well as the use of complex currency and credit derivatives structures. 

Two years ago Greece had to fess up to these lies because they were unable to repay their debt.  There was a loss of confidence prompting the rescue by other Eurozone countries, as they were the holders of much of this debt, and the International Monetary Fund.

This brings us to where we are today and one of the major questions the world is debating... ”Whether or not the Euro will survive”.  I will discuss some of these opposing viewpoints in the next and final installment of this series.

Source:  Spiegel Online International

Link to:

Lesson 1: A Little History Behind the Euro Zone Crisis

Lesson 2: Who’s in the Euro Zone and Why Was It Established?

Lesson 3: The Beginning of the End


The information has been obtained from sources considered to be reliable, but we do not guarantee that the foregoing material is accurate or complete.  Any opinions are those of Center for Financial Planning, Inc., and not necessarily those of RJFS or Raymond James.

Euro 101: The Beginning of the End

 Europe is no stranger to crisis.  Not all of their crises are self-imposed, however.  Popular as it may be to blame the Europeans for the current crisis, we must dig a bit deeper to get at some of the root causes of today’s problems and look more globally. 

In 1971, President Nixon pulled out of the Bretton Woods Accord removing the gold backing from the US Dollar (during Bretton Woods the US dollar had been pegged to the price of gold and all other currencies were pegged to the US dollar), allowing the dollar to float as it does today. This action had far-reaching consequences.  Shortly thereafter, many European countries followed suit with their currencies.

Nations, including the US, started to increase their reserves by printing money in large amounts essentially decreasing the value of their currencies.  Because oil was priced in US dollars, this resulted in an immediate pay cut to the oil producers. The Organization of Petroleum Exporting Countries (OPEC) eventually answered by pricing a barrel of oil against gold instead.

This domino effect ultimately caused the "Oil Shock" of the mid-1970s.  For two decades prior, the price of oil in U.S. dollars had risen very slowly and steadily by less than two percent per year.  Look at the blue (Nominal) line in the graph below, that is the oil price unadjusted for inflation.  Suddenly after 1971, oil became extremely volatile and expensive. 

http://en.wikipedia.org/wiki/1973_oil_crisis

To add insult to injury, oil exports were limited to many European nations. This led to a drastic slowdown in the European standard of living in the 1970’s causing the local governments to take on more and more debt to mitigate these effects. And so it began until the establishment of the Maastricht Treaty, which I will discuss in our next lesson.

Lesson 1:  A Little History Behind the Euro Zone Crisis

Lesson 2:  Who’s In the Euro Zone and Why Was It Established?


The information contained in this report does not purport to be a complete summary or statement of all available data necessary for making an investment decision and does not constitute a recommendation.  The information has been obtained from sources considered to be reliable, but we do not guarantee that the foregoing material is accurate or complete.  Any information is not a complete summary or statement of all available data necessary for making an investment decision and does not constitute a recommendation.    Any opinions are those of Center for Financial Planning, Inc., and are not necessarily those of RJFS or Raymond James.  Past performance may not be indicative of future results.  Gold is subject to the special risks associated with investing in precious metals, including but not limited to:  price may be subject to wide fluctuation; the market is relatively limited; the sources are concentrated in countries that have the potential for instability; and the market is unregulated.  Investing in oil involves special risks, including the potential adverse effects of state and federal regulation and may not be suitable for all investors.