Investment Planning

House Hunting How-To: Deciding on the Best Down Payment

 You have decided to purchase a new home. Now questions start racing through your mind. How much do we put down?  What is our interest rate going to be?  Do we get a fixed loan or a variable loan? Do we finance it over 15 years or 30 years? In today’s historically low interest rate environment the answer to some of these questions may surprise you.

Let’s take a scenario between John Doe and John’s identical twin brother Jack Doe.  John and Jack have the same exact job, the same income, and the same assets.  Everything about them is the same except for how they approach money decisions.  John is a firm believer in staying out of debt. He doesn’t believe in financing anything. He pays cash for cars, houses, vacations etc…  Jack on the other hand believes that responsible use of debt could be a good way to get ahead in life.  He firmly believes that you shouldn’t put more then 20% down on a house, you should finance a car, especially when interest rates are less then 3%, he’ll even put a vacation on a credit card to earn the mileage points, making sure he pays it off within a month or two. 

John and Jack are looking to purchase an identical home in the same neighborhood; same square footage, same interior design, same lawn animals, same everything.  The purchase price of the house is $250,000. They both have identical investment portfolios valued at $250,000. John has the option to finance it with a 30-year fixed loan at 3.5%.  But instead John takes a look at his finances and decides he will take the money out of his investment portfolio and buy the house outright.  John now has no money left in his investment portfolio, but at least this will save him that pesky $1,200 mortgage payment over the next 30 years. He doesn’t like the fact that his investment portfolio now has a 0 balance, but he intends to rebuild his drained investment account by adding $1,200 each month. 

Jack, on the other hand, decides he is only going to put down 20% on the house and keep the rest of his money invested. He needs to come up with 20% of $250,000, or $50,000. After the down payment, Jack will have $200,000 remaining in his investment account.  He won’t be able to add any funds to his investment account because he needs that money to pay the mortgage.

Let’s break down the impact of their decisions after 10 years factoring at a 6% interest rate compounded annually for their investments. Let’s also assume the value of their homes has also appreciated in value at 6%:

Jack has less equity in his house because he put 20% down so, after 10 years, he still owes the bank $150,000 on the original $200,000 mortgage note. From the totals, it might appear that Jack made a slightly better money decision, but life is not quite that simple.  We can’t possibly account for all the “what if’s” that life might throw at the two brothers over that 10 year period. 

Here are some things to consider: 

  • What if John had a sudden emergency such as an unexpected job loss over that 10-year period?  He has no liquidity to tap into to help him pay the bills because he spent it all on the house. 
  • How much mortgage interest can John deduct off his income tax bill annually?  None because he doesn’t have a mortgage! 
  • What if house prices in the neighborhood depreciate in value instead of appreciate?  Jack could potentially hand the keys back to the bank whereas John could be stuck with a rapidly depreciating asset.
  • What if John isn’t as disciplined as he thought he was and starts spending the $1,200 a month instead of saving it?  Jack might not be as prone to this problem because there is a big consequence to him not paying the bank $1,200 a month which is that he loses the house.   

As you can see, having a mortgage might not be the worst thing in the world. Even though it bucks the traditional value of having a home paid off as quickly as possible, there can even be some advantages to using debt responsibly. Make sure you talk to your financial planner when deciding if you’ll follow Jack or John’s example.


The example contained herein is hypothetical and for illustration purposes only.  It is not intended to reflect the actual performance of any particular investment.  Actual investor results will vary.  Investing involves risk and investors may incur a profit or a loss.  Any information is not a complete summary or statement of all available data necessary for making an investment decision and does not constitute a recommendation.  Any opinions are those of Center for Financial Planning, Inc., and not necessarily those of RJFS or Raymond James.  You should discuss any financial or mortgage matters with the appropriate professional.

Is the Lost Decade Already Forgotten?

 So you or your financial planner has taken the time to put together a well-diversified portfolio.  Now what?  Disappointed lately after opening your statements?  Well you aren’t alone!

Investors everywhere have been left wondering, “Why isn’t my portfolio up more when I keep hearing of the market hitting new highs this year?”  It was not uncommon to see a diversified portfolio (40% S&P 500/20% MSCI Eafe/40% Barclays Capital Aggregate Bond Index) with a gain less than 5% for the 6 month time period ending June 30th 2013. That’s at the same time the S&P 500 gained more than 13% including dividends!  Further diversify with commodities or real estate and your returns likely looked even worse.

This left investors wondering, “Why don’t I just own more U.S. stocks if they are producing such stellar returns this year while everything else (bonds, commodities, emerging markets and real estate) has produced very ho hum to negative results?”  How quickly we have already forgotten the “lost decade.” 

I’m referring to the 10 year time period throughout the 2000’s when the S&P 500 produced a negative total return.  This was a very difficult time period starting with the burst of the dot-com bubble and ending with the financial crisis of 2008.  Many felt like there was nowhere to hide during this time period.  In reality however, those with a widely diversified portfolio had quite the opposite results.  Sure a portion of their portfolio was flat to down but many of the other areas of their portfolio performed quite well over this decade, boosting their overall portfolio returns.  The chart below illustrates average annual returns from some of the major Morningstar categories from 2000-2009.  The lost decade only applied to one type of investment one could own.

Chart and data courtesy John Hancock® Investments

Coming into this lost decade, investors were asking the very same questions we are hearing now and the chart above shows us how that ended.  While we don’t believe we are on the doorstep of another lost decade, we do feel it is not the time to abandon diversification.  So, when you open your statements this year, you may be left wondering, “Where’s the Beef?”  But be careful before making any drastic changes to your portfolio.  Talk to your financial planner first!

Angela Palacios, CFP®is the Portfolio Manager at Center for Financial Planning, Inc. Angela specializes in Investment and Macro economic research. She is a frequent contributor to Money Centered as well asinvestment updates at The Center.


The information contained in this report does not purport to be a complete description of the securities, markets, or developments referred to in this material. The information has been obtained from sources considered to be reliable, but we do not guarantee that the foregoing material is accurate or complete. Any information is not a complete summary or statement of all available data necessary for making an investment decision and does not constitute a recommendation. Any opinions are those of Angela Palacios and not necessarily those of RJFS or Raymond James. Past performance may not be indicative of future results. Diversification does not ensure a profit or guarantee against a loss.

Bonds represented by Barclay's Aggregate Bond Index a market-weighted index of US bonds. US Large Companies per S&P 500 Index a market-cap weighted index of large company stocks. International stocks measured by MSCI EAFE is a stock market index designed to measure the equity market performance of developed markets outside of the US and Canada

3 Lessons Investors Can Learn from Miguel Cabrera

 I grew up in a sports-loving household – playing sports and watching sports was a large part of my youth.  It should not be surprising that many of my key life lessons have been learned through sports analogies.  As I watch Miguel Cabrera -- one of the greatest hitters in Major League Baseball --  I can’t help but notice how investors might learn from three of his key skills:

  1. Always keep your eye on the ball – Remember that your investments are tools to get you to your planning goals; don’t let the ups and downs of the market cause you to lose sight of your long-term goals.
  2. Swing for a base hit – Keep your investment strategy balanced and stick to the fundamentals.  Taking big “swings” with trendy investment vehicles or making big shifts in your allocations may put you at risk for striking out.
  3. Hit for average – The goal of your investment portfolio should be to return what is needed to reach your financial planning goals within your tolerance for risk.  Maintaining a moderate, but positive, average return over your financial life can get you farther than those who try to swing for the fences, but strike out more times than not.

As you are watching your favorite baseball team this season, keep in mind that the best hitters, like the best investors, stick to the fundamentals.  And don’t forget, your financial planner can be your most valuable hitting coach.

Sandra Adams, CFP® is a Financial Planner at Center for Financial Planning, Inc. Sandy specializes in Elder Care Financial Planning and is a frequent speaker on related topics. In 2012 and 2013, Sandy was named to the Five Star Wealth Managers list in Detroit Hour magazine. In addition to her frequent contributions to Money Centered, she is regularly quoted in national media publications such as The Wall Street Journal, Research Magazine and Journal of Financial Planning.


Five Star Award is based on advisor being credentialed as an investment advisory representative (IAR), a FINRA registered representative, a CPA or a licensed attorney, including education and professional designations, actively employed in the industry for five years, favorable regulatory and complaint history review, fulfillment of firm review based on internal firm standards, accepting new clients, one- and five-year client retention rates, non-institutional discretionary and/or non-discretionary client assets administered, number of client households served.

Any information is not a complete summary or statement of all available data necessary for making an investment decision and does not constitute investment advice.  Prior to making an investment decision, please consult with your financial advisor about your individual situation. Any opinions are those of Center for Financial Planning, inc., and not necessarily those of RJFS or Raymond James.  Investing involves risk, and investors may incur a profit or a loss.

Signs Say Housing is Back

 If you haven’t noticed here locally, the housing market has really changed.  A client told me of a house they tried to purchase in the Detroit suburbs that had 70 offers last week. It was just two or three years ago when you couldn’t give these places away.

A recent well-known gauge for housing, the S&P/Case-Shiller 20-City Composite Home Price Index, which was released in May, posted the biggest gain in seven years.

The 20-city index--one of several S&P/Case-Shiller housing indices--showed a 10.9% gain between March 2012 and March 2013, the highest increase since 2006. In addition, all 20 cities tracked by the index had gains for three straight months. But not all markets are equal. Consider that San Francisco and Phoenix saw large price jumps of more than 20%. However, New York and Boston had smaller gains of 2.6% and 6.7%, respectively.

Also consider that all economic assets are eventually just a supply/demand equation. Prices should be rising given the low supply of homes, less new construction, relatively low prices, and low mortgage rates.

As for the economy as a whole, rising home prices often serve as an indicator that the economy is performing better since it generally demonstrates increased consumer confidence. And while this latest report is good news for homeowners looking to sell, it also provides welcome news to underwater homeowners who may now see an increase in their home equity.

Another gauge of the housing market is that a large number of institutional investors are buying properties to rent—suggesting that there is still a ways to go in terms of a full-fledged housing recovery.

You may hear people worry that another housing bubble is in the cards. Well not so fast! Consider that this economy is built on different terms than the one that led to the housing bubble burst in 2006. Those differences include a tighter mortgage lending environment and houses that may still be undervalued at prices that are significantly lower than they were at their 2006 peak.

Matthew E. Chope, CFP ® is a Partner and Financial Planner at Center for Financial Planning, Inc. Matt has been quoted in various investment professional newspapers and magazines. He is active in the community and his profession and helps local corporations and nonprofits in the areas of strategic planning and money and business management decisions. In 2012 and 2013, Matt was named to the Five Star Wealth Managers list in Detroit Hour magazine.


Five Star Award is based on advisor being credentialed as an investment advisory representative (IAR), a FINRA registered representative, a CPA or a licensed attorney, including education and professional designations, actively employed in the industry for five years, favorable regulatory and complaint history review, fulfillment of firm review based on internal firm standards, accepting new clients, one- and five-year client retention rates, non-institutional discretionary and/or non-discretionary client assets administered, number of client households served.

The information contained in this report does not purport to be a complete description of the securities, markets, or developments referred to in this material.  The information has been obtained from sources considered to be reliable, but we do not guarantee that the foregoing material is accurate or complete.  Any opinions are those of Center for Financial Planning, Inc., and not necessarily those of RJFS or Raymond James.

Why Being an Investor is Like Being a Sports Fan

20130711a.jpg

As an enthusiastic fan of the Detroit Tigers, I entered into this baseball season with high expectations.  According to Las Vegas odds-makers, our local team is the favorite to win this year’s World Series, given the talented roster we have in place.  As the season has gone on, I have found myself riding a rollercoaster of emotions as the team has had impressive streaks of success, as well as discouraging displays of mediocrity.  In a way, this reminds me of the emotions many of us feel as investors as we watch the ebbs and flows of the stock market.

Behavioral Finance

Behavioral finance is a term used to describe the behavioral and psychological reasons why people make irrational financial decisions.  Interestingly, many of these behavioral tendencies are similar to those of sports fans.

  • Following the Crowd (herding) – As investors and as sports fans we may jump on and off the bandwagon. As investors, we may panic and decide to make dramatic shifts in our asset allocation in reaction to a market downturn or upswing. As sports fans, we may bet our entire fortune on our favorite team when they’re winning or move our allegiance to another team altogether when they’re losing.

  • Short-term Focus – With investments, as with sports, we care about what’s happening now, but can lose sight of the long-term goal. It is hard to keep in mind that the 5 game losing streak (or 5% market pull-back) may have little to no impact on the team’s record after 160 games (or achieving the results we need to meet our retirement goals).

  • Finding Someone (or Something) to Blame – When things aren’t going well, there is always a scapegoat. When our favorite sports team is doing poorly, we can always find one player or coach that’s to blame. When our investments aren’t performing the way we’d like, we can find an investment vehicle or manager to blame. Know that if you have good line-up and a solid strategy, there is no need to place blame (especially when the investment you blame now may be your best performer next year!)

The ability to avoid reacting irrationally is the sign of a long-term investor and of a loyal sports fan.  When it comes to investing, your financial planner can be your best coach, helping you to stay in the game, even when the going gets rough!

Sandra Adams, CFP®is a Financial Planner at Center for Financial Planning, Inc. Sandy specializes in Elder Care Financial Planning and is a frequent speaker on related topics. In addition to her frequent contributions to Money Centered, she is regularly quoted in national media publications such as The Wall Street Journal, Research Magazine and Journal of Financial Planning.

Any opinions are those of Center for Financial Planning, Inc., and not necessarily those of RJFS or Raymond James.  Investing involves risk and investors may incur a profit or a loss.

A New Kind of Bucket List

 Retirees love to talk about their Bucket Lists, their current adventures and travel, and all the things they would like to do before it is too late.  You can have great fun constructing this checklist of what is possible, what is probable, and maybe some things that are way out there.

This Bucket List theory can also apply well to retiree financial situations.  We know the volatility of the stock market causes people angst, distress, and can leave them unable to make decisions.  But think of your finances in two separate buckets.  The first is a cash bucket that has up to 18 months or possibly two years worth of cash that will be used for current spending.  This bucket includes pensions, social security, and income from investments that should be there for the designated time.

The second bucket is an investment bucket with a well-diversified portfolio, preferably managed by professionals. Although we never lose sight of the second bucket, we can let it ride through the normal gyrations of the financial markets.  This strategy can help provide investor confidence.

Our cash bucket can be replenished by adding dividends from the fixed income portion of our investment bucket.  Some folks like to add a third bucket, a wish list bucket to have cash available to fulfill the traditional Bucket List of adventures.  This can be filled when we do not spend as much as planned and with potential excess appreciation of portfolios.

So while you’re dreaming up exotic destinations, mountains to climb, or wineries to visit, also make plans to fill your financial buckets. It will make it much easier to check off the things you’ve waited your whole life to do!


Any information is not a complete summary or statement of all available data necessary for making an investment decision and does not constitute a recommendation.  Investing involves risk and you may incur a profit or loss regardless of strategy selected.  Diversification does not ensure a profit or guarantee against a loss.  Dividends are not guaranteed and must be authorized by the company’s board of directors.

Tales of Inflation

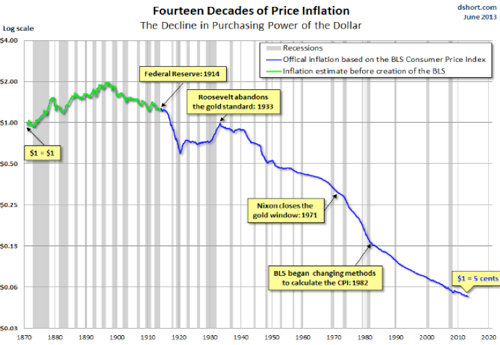
 As a kid I fondly remember sitting around hearing stories from my parents’ childhoods.   While I gave some stories more credence than others, there were many interesting lessons to learn if you could get past the obvious embellishments.  For example, even at a young age, I recognized it was impossible to walk up hill all the way both ways to school if there was only one route to take.  However, other stories show the power inflation can have on our buying power as is exhibited in the chart below.  Perhaps Dad wasn’t embellishing when he said a candy bar only cost a nickel.

The chart shows that $1 today only purchases what a nickel would have purchased in 1871 and again in 1933!  While inflation is quite low right now (1.4% as of the June 18th 2013 report by the Bureau of Labor Statistics) it likely won’t stay this way forever as history has shown.  Inflation can have a devastating effect on retirement planning if your plan and asset allocation aren’t structured to handle it. 

Someday, while my daughter may never believe I lived without an iPad (or whatever the advanced version is at that time), she will surely roll her eyes at the idea that a Starbucks latte cost less than $5 in 2013! So, while I suggest properly planning for inflation, you might also collect a little evidence in the here and now to back up your stories down the road.

Angela Palacios, CFP®is the Portfolio Manager at Center for Financial Planning, Inc. Angela specializes in Investment and Macro economic research. She is a frequent contributor to Money Centered as well asinvestment updates at The Center.


The information contained in this report does not purport to be a complete description of the securities, markets, or developments referred to in this material.

In Life & In Investing, Knowledge is Not Experience

 Some people are very smart; they have many designations and/or degrees.  They are well-read in the big topics of life. But that does not mean they are experienced in all areas.  The luxury of working with fantastic entrepreneurs, scientist, doctors, lawyers and accountants is a daily way of life at the Center.  These fabulously smart people in their area of expertise delegate the area of their life that they don’t have the time or interest that is necessary to become an expert.

When the financial meltdown was fully in gear between September of 2008 and March of 2009 and when GM and other large companies were going bankrupt, many in our industry and even more outside of the industry were losing their heads (believing that the world might actually come to an end). Internally we were discussing much more productive things. We believed that it was not the end of the world. In fact, we believed that the investments we maintained for clients were real and people would be using the products and services generated by these companies for generations to come.

A doctor told me once that an expert knows more and more about less and less.  He performed one type of surgery every day for over 10 years.   He went to medical school and spent over 12 years in total with his education, much of the last 4 years focused on one area.  He went on to tell me that education is one necessary ingredient – it’s the foundation for wisdom -- but without repetition, you don’t have experience.  At the Center we pride ourselves on the foundation of knowledge but leverage our many years of experience to help clients reach their goals.

Matthew E. Chope, CFP ® is a Partner and Financial Planner at Center for Financial Planning, Inc. Matt has been quoted in various investment professional newspapers and magazines. He is active in the community and his profession and helps local corporations and nonprofits in the areas of strategic planning and money and business management decisions. In 2012 and 2013, Matt was named to the Five Star Wealth Managers list in Detroit Hour magazine.


Five Star Award is based on advisor being credentialed as an investment advisory representative (IAR), a FINRA registered representative, a CPA or a licensed attorney, including education and professional designations, actively employed in the industry for five years, favorable regulatory and complaint history review, fulfillment of firm review based on internal firm standards, accepting new clients, one- and five-year client retention rates, non-institutional discretionary and/or non-discretionary client assets administered, number of client households served.

The information contained in this report does not purport to be a complete description of the securities, markets, or developments referred to in this material.  This information is not intended as a solicitation or an offer to buy or sell any security referred to herein.  Any opinions are those of Center for Financial Planning, Inc., and not necessarily of RJFS or Raymond James.

Black Monday? How about Ruby Tuesday?

 Most investors are familiar with the infamous “Black Monday” stock market crash.   The Dow Jones Industrial Average (DJIA) dropped by a whopping 22.61% in one day on Monday October 19, 1987.  Many may not be as familiar with records that are being set right now for Tuesdays.  May 28th marked the 20th Tuesday in a row where the Dow Jones Industrial Average ended on an up note.  This is a record breaking streak of gains for any specific day of the week in the history of the DJIA.  The previous high count was 13 days in a row and has occurred on 3 separate occasions for Monday, Wednesday and Friday with the most recent streak occurring in 1900! 

This Tuesday winning streak that began on January 15th has included 1,573 points for the Dow or 83% of the years gains for the index as of May 28th.  The picture below is a total of Year to date points made or lost cumulatively on the particular day of the week for the DJIA. 

http://buzz.money.cnn.com/2013/06/04/dow-tuesday-streak/

There has been much speculation as to why Tuesday has been so great? 

Here are some of the arguments.

  • The federal reserve is buying bonds through their open market operations on Tuesday and Friday’s
  • Retail investors placing mutual fund buy orders on Monday, after looking at their accounts over the weekend, and then the managers are putting that money to work on Tuesday.
  • Automated trading programs that seek out trends have noticed this trend and started to buy in anticipation, and as such, perpetuating the trend.
  • Or it could just be random

While the debate of why this phenomenon has occurred may not be over, unfortunately, the winning streak itself is over as of Tuesday June 4th.

http://www.bespokeinvest.com/thinkbig/2013/5/28/20-for-tuesday.html

Angela Palacios, CFP®is the Portfolio Manager at Center for Financial Planning, Inc. Angela specializes in Investment and Macro economic research. She is a frequent contributor to Money Centered as well asinvestment updates at The Center.


The information contained in this report does not purport to be a complete description of the securities, markets, or developments referred to in this material. The information has been obtained from sources considered to be reliable, but we do not guarantee that the foregoing material is accurate or complete. Any information is not a complete summary or statement of all available data necessary for making an investment decision and does not constitute a recommendation. The Dow Jones Industrial Average (DJIA), commonly known as “The Dow” is an index representing 30 stock of companies maintained and reviewed by the editors of the Wall Street Journal. Keep in mind that individuals cannot invest directly in any index, and index performance does not include transaction costs or other fees, which will affect actual investment performance. Individual investor's results will vary. Past performance does not guarantee future results.

CNBC Ratings as a Leading Indicator?

 This may be the most unique candidate for a leading indicator I’ve run across in a long time.  A leading indicator is defined as a measurable economic factor that changes before the economy starts to follow a particular pattern or trend.  You may have heard of an inverted yield curve predicting recessions or the number of building permits applied for predicting a housing boom or bust.

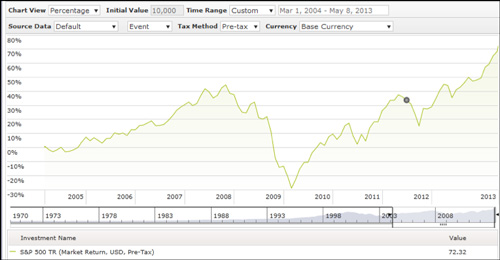
How about CNBC viewership predicting the next stock market boom or bust?  Below is a chart showing Nielson Ratings for CNBC over the last eight years.  The last time their ratings were this low was 2005 when markets had stablized after the tech bubble burst and we had enjoyed a couple of years of good returns.  Sound familiar?

As you can see in the chart below of the S&P 500 total returns, 2005 was the start of some very nice returns which continued for the next few years.  Could the low viewer ratings be a potential indicator that the returns we have experienced since 2009 are just the beginning?  As returns accelerated toward the market peak in 2007 so did CNBC’s ratings into 2007. 

Data from Morningstar

As individual investors start to jump on the band wagon of a bull market run, they become more interested in what is happening to their money and thus turn on the news.

There are many reasons investors could be choosing not to watch the channel now:

  1. Investors have been lulled into a sense of security about market returns and aren’t concerned about current events
  2. Many are not actually invested in the markets; therefore, they do not care
  3. Investors are finding their information elsewhere
  4. They have grown tired of the sensationalizing the network does to try to get better ratings (which is actually my main reason for not watching)

Assuming investors aren’t watching anymore because of one of the first two reasons, then this could be a very good indicator of what is to come, potential positive returns as more individuals put money back to work in the markets.

It is too bad there isn’t much historical data to determine if this is, indeed, a good stock market indicator but it is definitely something from CNBC that is much more interesting to follow than their overly dramatic, TV personalities!

Angela Palacios, CFP® is the Portfolio Manager at Center for Financial Planning, Inc. Angela specializes in Investment and Macro economic research. She is a frequent contributor to Money Centered as well as investment updates at The Center.


Any opinions are those of Center for Financial Planning, Inc., and not necessarily those of RJFS or Raymond James.  Any information is not a complete summary or statement of all available data necessary for making an investment decision and does not constitute a recommendation.  Keep in mind that individuals cannot invest directly in any index, and index performance does not include transaction costs or other fees, which will affect actual investment performance.  Individual investor’s results will vary.  Past performance may not be indicative of future results.