US Stocks

Employee Stock Options: What Really Matters from Grant to Sale

Green road sign reading “Options Just Ahead” against a bright sky, symbolizing employee stock options, financial opportunities, and long-term wealth planning.

Robert Ingram Contributed by: Robert Ingram, CFP®

Print Friendly and PDF

Non-qualified stock options (NQSOs) are a form of employer compensation that gives an employee the right to purchase a specific number of company shares at a predetermined price within a defined time period. Unlike direct stock grants Restricted Stock Units (RSUs), which provide actual shares of stock, NQSOs offer the option, but not the obligation, to buy shares in the future.

If you have access to these stock options, they can be one of the most valuable opportunities to build wealth through your employer—but they are also frequently misunderstood. On the surface, it might seem straightforward: you can buy your company’s stock at a set price and benefit from future growth. In practice, stock options involve a series of decisions that can have financial and tax consequences that unfold over time. From grant and vesting to exercise and eventual sale, each stage in the lifecycle of these NQSOs carries its own rules and implications for the value you ultimately realize.

Grant: It Starts with a Promise (Not Ownership)

When your company grants you stock options, you don’t actually receive stock. You receive something much more subtle: the right to buy stock later at a fixed price.

You’re told:

  • How many options you have (number of shares you could buy)

  • At what price you’ll be able to buy them (exercise price)

  • When you’ll be allowed to use that right (the vesting schedule)

  • And when the opportunity expires

As a hypothetical example, let’s say you were granted 4,000 options on May 1st, 2026, with an exercise price of $20 per share. The vesting schedule is that 25% of the total options vest after one year, and the remaining 75% of the options vest quarterly over the next three years. Finally, the expiration date is May 1st, 2036 (10 years from the grant date). Whoa! There’s a lot there. Let’s tackle it in stages.

At this stage, nothing has happened financially. No cash or value is exchanged. There are no actionable steps, and there is no taxation. There is just the potential opportunity that begins when your options vest.

Vesting: You Earn the Right to Act

Over time, those options that were granted “vest.” This means that the options become exercisable. The option becomes “yours,” and you can choose to exercise (or not exercise) the options (i.e., purchase shares with some or all of the vested options).

In most employee stock option plans, vesting is gradual, often spread out over a few years.

In our example above, the first 1,000 options vest one year from the grant date, so they would be exercisable on May 1st, 2027. From there, portions of the unvested shares vest each quarter for the next three years.

The following table illustrates how a vesting schedule might look, where each quarter an equal number of options vest from the end of year 1 until the end of year 4.

tock option vesting schedule table showing 4-year NQSO vesting with 1-year cliff and quarterly vesting thereafter, totaling 4,000 options

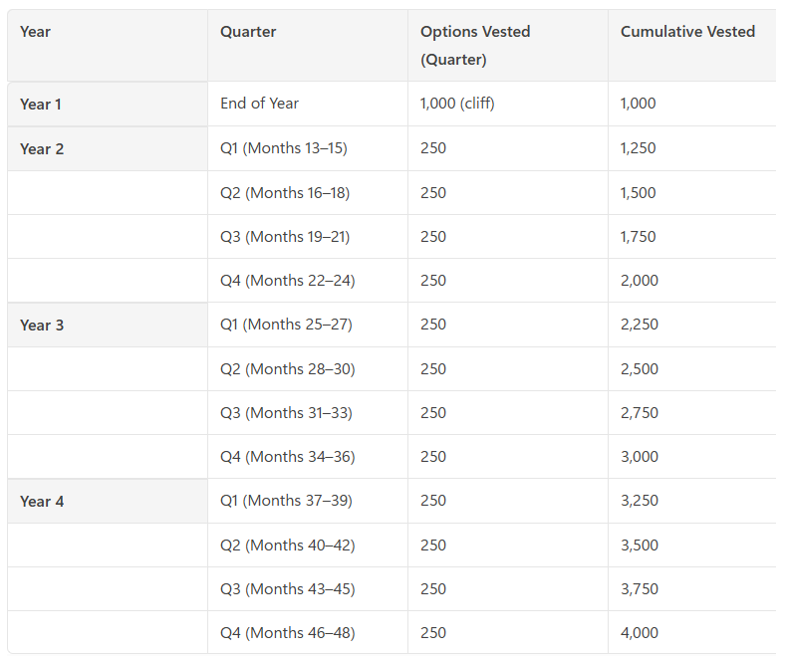
While this is a common type of vesting schedule, it is very important to understand your own employer’s specific vesting plan and to know when your options will be available to exercise. Until the options vest, they are not truly “yours,” and you may forfeit any future right to exercise them if you leave the employer, for example.

But here’s a key point about each vesting date: at vesting, still nothing happens financially. Vesting does not trigger taxes.

This is different from other types of equity compensation, such as Restricted Stock Units (RSUs). When RSUs vest and you receive shares, the total value of the shares at that time is considered income and would be reported and taxed as ordinary income.

When non-qualified stock options vest, there is still no action taken, and you haven’t received the value of any options, so there is no reported income or associated taxes. But now, your planning and decision-making start.

Exercising: When You Buy—and Taxes Kick In

Eventually, you reach the first decision point: do you exercise your options?

The value of stock options comes from the difference between what you’re allowed to pay for the stock and what it’s actually worth in the market.

So, from our example, let’s say you have options that have vested, and the value of the stock in the market is $45 per share. Because your options have an exercise price of $20 and you could purchase shares for $20, there is a gain of $25 per share ($45 - $20). The options allow you the opportunity to build that value without having to buy the shares outright (yet!).

Now, when you do exercise options (i.e., buy the shares) at any time up until the expiration date, this is where things change and taxes come into play.

At the time you exercise, the difference between the market value of the shares and the price you are able to pay to buy them is considered income and is reported to the IRS. In our example, if the value at the time of exercise is $45 per share and your purchase price is $20, you would have ordinary income of $25 per share.

If you exercised 1,000 shares, that would be 1,000 × $25 → $25,000 in taxable income.

Many people assume taxes happen when they sell the shares. While sales can and often do occur around the same time as the exercise, the exercise itself often triggers the biggest tax impact.

If you choose to exercise options in a high-income year, the extra income may push you into higher tax brackets. Another scenario is waiting to exercise large groups of options all at once. This could also dramatically change your overall income in that year and therefore impact your tax liability. This is why careful tax planning is an important part of managing your stock options.

Quick Note on Taxes at Exercise (and How They’re Paid)

Taxes here aren’t just reported and owed—they’re typically withheld. Employers are generally required to withhold taxes at the time of exercise. This usually includes federal taxes, state income tax, Social Security, and Medicare (FICA taxes). How is the withholding paid?

Methods for covering taxes:

  • Cash payment (out of pocket) – sending payment from your bank or wire transfer to cover the taxes

  • Selling shares to cover – the plan sells a portion of exercised shares to cover the taxes

    • This is the most common approach used

  • Withholding shares – the plan withholds a number of shares equal in value to the taxes instead of selling shares on the market

    • This is less common for public company stock option plans

Selling Shares: Turning the Value into Cash

To fully realize the usable value of the options and shares, you would sell the shares for cash as the final financial outcome and decision.

Taxes may come into play again after you exercise and sell your shares (as capital gains or losses).

Remember, at exercise, the difference between the market value and the exercise price is already taxed as income, so the cost basis of the exercised shares becomes the market value at the time of exercise.

Cost basis in our example: if exercising shares when market value was $45 → cost basis = $45

If you were to sell those shares for $55, for example → you would have a $10 capital gain.

If, on the other hand, you sold the shares at $35 → you would have a $10 capital loss.

Depending on when you choose to sell your exercised shares, you could have a short-term capital gain or loss (if held for less than one year) or a long-term capital gain or loss (if held for more than one year). With the tax treatment differences between short-term and long-term capital gains, this again adds further tax planning considerations to your decisions.

Note: You are typically responsible for any taxes associated with these capital gains or losses, as they are not withheld by the employer plan.

From Exercise to Ownership to Selling: (How You Get There)

When you exercise your options, you’re no longer holding an option—you now own stock. There is generally no maximum holding period before having to sell, and there is no risk of losing rights to the shares if you leave the employer, retire, etc.

But there are a few methods for exercising options and turning them into real value.

  • Pay in cash (hold all shares) – covering the cost of the share purchases and usually the tax withholding by writing a check or transferring funds to the plan administrator. You retain all of the shares until you decide to sell some or all of them.

At this point, you might be asking, “What if I don’t have the cash, or I don’t want to use my funds to exercise the options?”

Cashless Exercise:

  • Sell some shares at exercise (hold some shares) – a portion of shares is sold immediately to cover the cost of the shares exercised (and usually the tax withholding). You retain the remaining shares.

You would then hold the remaining shares for investment until you decide to sell them.

The other type of cashless exercise is one of the most common methods for using options and converting them into usable value:

  • Cashless exercise (sell everything) – you exercise options, and all the shares are sold immediately, covering the cost of shares and taxes, leaving you with cash proceeds instead of stock.

This full cashless exercise allows you to turn the value of your options into cash in one step with no out-of-pocket cost and avoids the ongoing risk of holding the stock. That can be very advantageous for many people.

However, there may be cases where exercising options to hold shares makes sense. One advantage is that potential future growth may be taxed at capital gains rates, which could be lower than ordinary income rates. Depending on your current income and expected future income, this difference may significantly impact your overall outcome.

Bottom Line

Stock options are more than just a one-time benefit. They involve a process and decisions based on many factors over several years (even a decade or longer). Small differences in timing, taxes, and personal choices at each step add up to shape your results.

As with many complex financial decisions that have tax and other implications, you should consult with your financial planner and tax advisor.

If you’ve received stock options and aren’t completely confident in how they fit into your overall plan, we’re happy to have a conversation.

Please don’t hesitate to contact us!

Robert Ingram, CFP®, is a CERTIFIED FINANCIAL PLANNER™ professional at Center for Financial Planning, Inc.® With more than 15 years of industry experience, he is a trusted source for local media outlets and frequent contributor to The Center’s “Money Centered” blog.

Securities offered through Raymond James Financial Services, Inc., member FINRA/SIPC. Investment advisory services are offered through Center for Financial Planning, Inc. Center for Financial Planning, Inc. is not a registered broker/dealer and is independent of Raymond James Financial Services.

The foregoing information has been obtained from sources considered to be reliable, but we do not guarantee that it is accurate or complete. Any opinions are those of Bob Ingram, CFP® and are not necessarily those of RJFS or Raymond James. Raymond James Financial Services, Inc. and its advisors do not provide advice on tax issues, these matters should be discussed with the appropriate professional.

A History of Stock Returns During Conflict

Print Friendly and PDF

Wars are an awful part of humanity. The loss and destruction that comes from them is tragic. For this reason, the thought of a war starting can make investors want to act – maybe even sell their investments and stock up on cash under the mattress or gold bars in the safe.

It can feel like things are about to take a turn for the worse when a war or a conflict breaks out, but in times of stress it is important to lean on history and data as a guide to help determine the next best course of action.

See below for stock returns 3 months and 12 months after some key conflicts of the past 100 years. Does the data surprise you?

The average 12 month return after the beginning of these conflicts is POSITIVE 8.5%. Most of these you might remember from experience, maybe some better than others, but each of these conflicts came with their own unique set of fears. Some hit close to home, some happened overseas, some felt like escalations into something bigger, but all of these were world-altering events for the coming decades.

Despite that, on average, stocks continued to climb through the turmoil. The global economy and the global stock market are HUGE and complex machines that are going to grind forward no matter what is going on in the world. Some time periods will be a slower grind than others, but there are centuries of data that show time and time again stocks persevere, problem-solve, innovate, and grow their way through time.

The only way to participate in that growth, is to participate in that growth. Selling your stock investments is giving up whatever returns are coming next, for better or worse, and often not a winning strategy. During times of fear and stress, it is a better idea to lean on the diversification of your portfolio, your cash reserves, and your financial advisor to help guide you down your financial path and LIVE YOUR PLAN. Please reach out if you have any questions about yours.

Nicholas Boguth, CFA®, CFP® is a Senior Portfolio Manager and Associate Financial Planner at Center for Financial Planning, Inc.® He performs investment research and assists with the management of client portfolios.

Securities offered through Raymond James Financial Services, Inc., member FINRA/SIPC. Center for Financial Planning, Inc is not a registered broker/dealer and is independent of Raymond James Financial Services Investment advisory services are offered through Center for Financial Planning, Inc. The foregoing information has been obtained from sources considered to be reliable, but we do not guarantee that it is accurate or complete, it is not a statement of all available data necessary for making an investment decision, and it does not constitute a recommendation. Any opinions are those of Nick Boguth, CFA®, CFP® and not necessarily those of Raymond James.

Center Clients Donate $1.7 Million in Tax-Savvy Qualified Charitable Distribution Strategy in 2025

Lauren Adams Contributed by: Lauren Adams, CFA®, CFP®

Print Friendly and PDF

We are proud to announce that The Center assisted clients in donating $1,670,000 to charities using the Qualified Charitable Distribution (QCD) strategy in 2025!

The QCD strategy allows clients with assets in an IRA account and who are over age 70.5 to donate funds directly from their retirement account to a charity. Giving directly from an IRA to charity results in those dollar amounts not being included in taxable income for that year. That usually results in a lower tax bill for our clients and can also have positive downstream effects like lowering the amount they may pay for Medicare premiums and the portion of Social Security that is taxable to them, depending on their situation and income level. For those 73 or older, QCDs also count towards the distributions they need to take each year for their Required Minimum Distribution.

Now there are some caveats for QCDs – you need to be at least 70.5. Also, the charity has to be a 501(c)(3). And there are limits on how much you can give each year through this method – but that number is actually quite high at $111,000 per person per year right now.

The Center’s mission is to improve lives through financial planning done right, and we are so proud to be able to help clients make such a positive impact on the world (bonus points for it being in a tax-savvy manner!).

Did you know that QCDs are only one of many charitable giving strategies that our team helps clients deploy? Check out this video to learn more about ways our clients make their charitable dollars stretch further for the causes they care about while also potentially lowering their tax burden.

As always, we recommend you work with your tax preparer to understand how these strategies affect your individual situation. If you want to explore these strategies and more, contact your Center financial planner today!

Lauren Adams, CFA®, CFP®, is a Partner and CERTIFIED FINANCIAL PLANNER™ professional at Center for Financial Planning, Inc.® She works with clients and their families to achieve their financial planning goals.

Any opinions are those of Lauren Adams and not necessarily those of Raymond James. Expressions of opinion are as of this date and are subject to change without notice. Raymond James and its advisors do not offer tax or legal advice. You should discuss any tax or legal matters with the appropriate professional. Investing involves risk and you may incur a profit or loss regardless of strategy selected, including diversification and asset allocation. Prior to making an investment decision, please consult with your financial advisor about your individual situation.

What to Expect Every Day in the Stock Market

Print Friendly and PDF

I’ve written about expectations before, but I wanted to revisit the topic after a volatile day in the stock market this past January.

There was a headline that shook up the tech space, and when you opened a financial news website or turned on your TV – the headlines and reactions made it seem like we were entering the next financial crisis. I checked the markets to see what the damage was, and to my surprise, the S&P 500 was only down -1.46%! Sure, some stocks were down big, but the overall market was mixed. The Dow Jones Industrial Average was actually positive on the day, most bonds were positive, and international stocks were only down slightly. It was a volatile day in the markets, but nothing like the media was portraying.

It reminds me of the quote, “Happiness = expectations minus reality.” We often cannot change reality, but we CAN make sure we have realistic expectations. So, what expectations SHOULD we have for daily stock market moves?

Here’s some historical data on the S&P 500 for the past 40 years.

  • Worse than a -1% day: 1191 times, ~30 times per year, or ~2-3 times per month.

  • Worse than a -2% day: 350 times, ~9 times per year, ~2-3 times per quarter.

  • Better than a +1% day: 1350 times, ~34 times per year, or ~3 times per month.

  • Better than a +2% day: 306 times, ~8 times per year, or ~2 times per quarter.

So when the media talked about a -1.46% day like the world was ending, I found some relief in the data and the ability to say, “This might be big news, but a market move like this happens a couple of times per month.” It isn’t consistent, as you can see from the second chart. Some years give us more large down days than others, but that is part of the risk we accept when investing in the stock market. No risk, no reward!

There is noise coming at us all the time, which can make it hard to stay committed to our financial plan. The louder the noise, the more we might be pressured to do something-anything! But in an ideal world, our portfolio and financial plan are set up with the proper expectations so that we see right through the noise and can return to enjoying our life knowing that our financial plan is still on track. Please contact any of us at The Center if you have any questions about your investments or overall financial plan.

Nicholas Boguth, CFA®, CFP® is a Senior Portfolio Manager and Associate Financial Planner at Center for Financial Planning, Inc.® He performs investment research and assists with the management of client portfolios.

The foregoing information has been obtained from sources considered to be reliable, but we do not guarantee that it is accurate or complete, it is not a statement of all available data necessary for making an investment decision, and it does not constitute a recommendation. Investing involves risk and you may incur a profit or loss regardless of strategy selected. Diversification and asset allocation does not ensure a profit or protect against a loss.

The S&P 500 is an unmanaged index of 500 widely held stocks that is generally considered representative of the U.S. stock market. Inclusion of indexes is for illustrative purposes only. Keep in mind that individuals cannot invest directly in any index, and index performance does not include transactions costs or other fees, which will affect actual investment performance.

Any opinions are those of Nicholas Boguth, CFA®, CFP® and not necessarily those of Raymond James.

Center Clients Donate over $1.3 Million in Tax-Savvy QCD’s in 2024!

Lauren Adams Contributed by: Lauren Adams, CFA®, CFP®

Print Friendly and PDF

We are proud to announce that The Center assisted clients in donating over $1,350,000 to charities using the Qualified Charitable Distribution (QCD) strategy in 2024!

The QCD strategy allows clients with assets in an IRA account and who are over age 70.5 to donate funds directly from their retirement account to a charity. Giving directly from an IRA to charity results in those dollar amounts not being included in taxable income for that year. That usually results in a lower tax bill for our clients and can also have positive downstream effects like lowering the amount they may pay for Medicare premiums and the portion of Social Security that is taxable to them, depending on their situation and income level. For those 73 or older, QCDs also count towards the distributions they need to take each year for their Required Minimum Distribution.

Now, there are some caveats for QCDs — you need to be at least 70.5. Also, the charity has to be a 501(c)(3). There are limits on how much you can give each year through this method, but that number is actually relatively high at $108,000 per person per year right now.

The Center’s mission is to improve lives through financial planning done right, and we are so proud to be able to help clients make such a positive impact on the world (bonus points for it being in a tax-savvy manner!).

Did you know that QCDs are only one of many charitable giving strategies that our team helps clients deploy? Watch this video to learn more about ways our clients make their charitable dollars stretch further for the causes they care about while potentially lowering their tax burden.

As always, we recommend you work with your tax preparer to understand how these strategies affect your individual situation. If you want to explore these strategies and more, contact your Center financial planner today!

Lauren Adams, CFA®, CFP®, is a Partner, CERTIFIED FINANCIAL PLANNER™ professional, and Director of Operations at Center for Financial Planning, Inc.® She works with clients and their families to achieve their financial planning goals.

The foregoing information has been obtained from sources considered to be reliable, but we do not guarantee that it is accurate or complete, it is not a statement of all available data necessary for making an investment decision, and it does not constitute a recommendation. Any opinions are those of Lauren Adams, CFA®, CFP® and not necessarily those of Raymond James. While we are familiar with the tax provisions of the issues presented herein, as Financial Advisors of RJFS, we are not qualified to render advice on tax or legal matters. You should discuss tax or legal matters with the appropriate professional.

Securities offered through Raymond James Financial Services, Inc., member FINRA/SIPC. Investment advisory services are offered through Raymond James Financial Services Advisors, Inc.

Center for Financial Planning, Inc. is not a registered broker/dealer and is independent of Raymond James Financial Services.

Past Performance Is No Guarantee of Future Results!

Print Friendly and PDF

Over the past year, the S&P 500 has had a fantastic run and was up 38% (10/31/23 to 10/31/24). Does that mean we should expect lower returns in the next 12 months? Absolutely not, at least not for that reason.

Many investors get nervous after a very positive year. You may hear things like: 

  • “Stocks have been on a great run, so there is no way this can continue.”

  • “Trees don’t grow to the sky!”

  • “The past year was well above average; we’d expect mean reversion and lower returns going forward.”

But the truth is, the next year of stock returns has almost nothing to do with the previous year. The chart above shows the last 12 months’ return on the horizontal axis and the next 12 months’ return on the vertical axis. This is monthly U.S. large stock data since 1934 (90 years of data – over 1000 monthly readings!). If higher return years were generally followed by lower return years, you’d see the dots above in a tighter, more downward-sloping line. This is not a tight downward sloping line. This looks like my toddler got excited with a blue marker.

Statisticians call this a “random walk,” but practically speaking, all it means is that negative years can happen no matter what happened last year, and positive years can happen no matter what happened last year!  Past performance is no guarantee of future results. On average, though, we know that the stock market goes up more than it goes down, diversification is key to smooth out the ride, and a well-designed financial plan is the foundation of it all. Please contact any of us here at the Center if you have questions about any aspect of your financial plan. 

Nicholas Boguth, CFA®, CFP® is a Senior Portfolio Manager and Associate Financial Planner at Center for Financial Planning, Inc.® He performs investment research and assists with the management of client portfolios.

The foregoing information has been obtained from sources considered to be reliable, but we do not guarantee that it is accurate or complete, it is not a statement of all available data necessary for making an investment decision, and it does not constitute a recommendation. Investing involves risk and you may incur a profit or loss regardless of strategy selected. Diversification and asset allocation does not ensure a profit or protect against a loss.

The S&P 500 is an unmanaged index of 500 widely held stocks that is generally considered representative of the U.S. stock market. Inclusion of indexes is for illustrative purposes only. Keep in mind that individuals cannot invest directly in any index, and index performance does not include transactions costs or other fees, which will affect actual investment performance.

Any opinions are those of Nicholas Boguth, CFA®, CFP® and not necessarily those of Raymond James.

The Fed Just Cut Rates (Again) - Do CDs and Treasuries Still Make Sense?

Mallory Hunt Contributed by: Mallory Hunt

Print Friendly and PDF

The Federal Reserve’s recent decision to continue cutting interest rates has left many investors wondering about their next moves and how to adjust their portfolios. Safe investment options like Certificates of Deposit (CDs) and U.S. Treasuries remain viable options for conservative investors seeking stability and predictable income. As interest rates fluctuate, it’s crucial to assess whether now is a good time to invest in these types of investments or if other options might yield better returns based on you and your investment goals. Here’s why we think these instruments are still worth considering and how you can make the most of them in the current economic climate. Let’s break it down.

Understanding CDs & Treasuries

*A Certificate of Deposit (CD) is a time deposit offered by banks that typically provides a fixed interest rate for a specific term, ranging from a few months to several years. CDs are considered low-risk investments, often insured by the FDIC up to $250,000 per person on the account, making them appealing to conservative investors.

U.S. Treasuries are debt securities issued by the United States Department of the Treasury to finance government spending consisting mainly of Treasury Bills (short-term securities that mature in one year or less), Treasury Notes (medium-term securities that mature in 2 to 10 years) & Treasury Bonds (long-term securities that mature in 20-30 years). They are considered one of the safest investments because they are backed by the full faith and credit of the U.S. Government.

Why CDs Are Still a Good Investment

Despite the rate cuts, CDs continue to offer several benefits for conservative investors:

  1. Safety and Predictability: CDs provide defined income over a fixed term. If you’re risk-averse or looking to preserve capital, CDs can be a stable option, even in a lower-rate environment.

  2. No Market Volatility: Unlike stocks or bonds, CDs are not subject to market fluctuations, making them a reliable choice for those who prefer to avoid risk.

  3. Potential for Laddering: With a lower interest rate environment, you might consider a CD ladder strategy, where you stagger the maturity dates of multiple CDs. This allows you to take advantage of potential future rate changes while still securing some cash in safe, interest-bearing accounts.

As with any investment, what may be suitable for one investor might not be ideal for another. CDs do come with their own set of limitations such as potential liquidity constraints (tying up your funds for a predetermined period) or risks related to reinvestment and interest rates. It is crucial to be thoroughly informed on both the advantages and disadvantages of any investment before making a commitment.

The Appeal of U.S. Treasuries

U.S. Treasuries are another safe haven for investors, especially during periods of economic uncertainty:

  1. Government-Backed Security: Treasuries are backed by the full faith and credit of the U.S. government, making them one of the safest investments available.

  2. Variety of Options: Treasuries come in various maturities, from short-term bills to long-term bonds, allowing you to tailor your investments to your financial goals.

  3. Interest Rate Sensitivity: While treasuries’ yields may decrease following a rate cut, they often perform well during economic downturns as investors seek safe assets.

While the recent rate cuts may have reduced the yields on CDs and Treasuries on the front end of the curve, these instruments still offer valuable benefits for conservative investors. In fact, yields on CDs & Treasuries with longer maturities have actually INCREASED since The Fed began their rate cutting cycle. By employing strategies like laddering and diversification, you can navigate the changing interest rate environment and continue to achieve your financial goals. Keep an eye on economic indicators and remain flexible; the investment landscape can change quickly, and adapting your approach can lead to better outcomes. As always, consult with a financial advisor to tailor your investment strategy to your unique situation. Whether you choose CDs, Treasuries, or explore other avenues, making informed decisions is key to achieving your financial goals.

Mallory Hunt is a Portfolio Administrator at Center for Financial Planning, Inc.® She holds her Series 7, 63 and 65 Securities Licenses along with her Life, Accident & Health and Variable Annuities licenses.

This market commentary is provided for information purposes only and is not a complete description of the securities, markets, or developments referred to in this material. Any opinions are those of the author and not necessarily those of Raymond James. There is no guarantee that these statements, opinions or forecasts provided herein will prove to be correct. Investing involves risk and you may incur a profit or loss regardless of strategy selected. Past performance does not guarantee future results. Diversification and asset allocation do not ensure a profit or protect against a loss.

*Raymond James Financial Services, Inc., is a broker-dealer, is not a bank, and is not an FDIC member. All references to FDIC insurance coverage in relation to Brokered CDs and/or Market-Linked CDs address FDIC insurance coverage, up to applicable limits, at the insured depository institution that is disclosed in the offering documents. FDIC insurance only covers the failure of FDIC-insured depository institutions, not Raymond James Financial Services, Inc. Certain conditions must be satisfied for pass-through FDIC insurance coverage to apply.

The Shortened Trade Settlement Cycle

Mallory Hunt Contributed by: Mallory Hunt

Print Friendly and PDF

In the ever-evolving landscape of financial markets, efficiency is the name of the game. Every advancement that streamlines processes not only saves time and resources but also enhances market dynamics. One significant recent development is the shortened trade settlement cycle.

In the past, trade settlements took several days to complete, which meant longer periods of time until you could access your money. On May 28th, 2024, the U.S. Securities and Exchange Commission (SEC) is shortening the settlement cycle from the current two business days (Trade date + 2 or T+2) to one business day (T+1) for most securities transactions, including but not limited to trades for stocks, corporate and municipal bonds, mutual funds, and unit investment trusts (UITs).  

What does this mean for you, and why does it matter? At its core, a shortened settlement cycle reduces the time it takes for a trade to be finalized, allowing you to receive faster payment following the sale of a security. Keep in mind that this also means you will be required to provide funds more promptly following the purchase of a security or interest, which will begin accruing after the settlement date if the debit has yet to be covered. 

While the benefits of shortened settlement cycles are clear, the implementation is not without challenges. Market infrastructure, including trading platforms, clearing and settlement systems, and regulatory frameworks, must adapt to support faster settlement processes effectively by investing in technology and operational enhancements. Coordination between exchanges, clearinghouses, custodians, and regulators is essential to ensure a seamless transition in these processes and compliance with new requirements.

Nevertheless, the benefits of a shorter settlement cycle far outweigh the challenges and are a testament to the industry's ongoing commitment to efficiency and innovation. By streamlining the process of buying and selling securities, market participants can enjoy greater confidence, increased liquidity, and enhanced operational efficiency. You can find more information about this industry-wide change here. As with anything, if you have any questions on this upcoming change, please do not hesitate to reach out to us!

Mallory Hunt is a Portfolio Administrator at Center for Financial Planning, Inc.® She holds her Series 7, 63 and 65 Securities Licenses along with her Life, Accident & Health and Variable Annuities licenses.

The information has been obtained from sources considered to be reliable, but we do not guarantee that the foregoing material is accurate or complete. Any opinions are those of Mallory Hunt and not necessarily those of Raymond James.

Securities offered through Raymond James Financial Services, Inc., member FINRA/SIPC. Investment advisory services are offered through Center for Financial Planning, Inc. Center for Financial Planning, Inc. is not a registered broker/dealer and is independent of Raymond James Financial Services.

Should I Invest When Markets Are Making New Highs?

Print Friendly and PDF

While it may seem counterintuitive, the answer can be yes! The chart below shows forward returns for the S&P500 when investing on days when the market is making new highs. The green bar shows the average forward returns when investing on a day the market makes a new high, and the gray bar shows the forward returns on average when investing on any day. You might be surprised to learn that the outcome is usually better when investing when markets are making new highs!

Think about timing the market less and focusing more on your short- and long-term financial goals. Deciding when and how to invest is more nuanced and needs to be tailored to your situation rather than focusing on short-term market fluctuations. If you are uncertain about the best course of action, ask your financial planner!

Angela Palacios, CFP®, AIF®, is a partner and Director of Investments at Center for Financial Planning, Inc.® She chairs The Center Investment Committee and pens a quarterly Investment Commentary.

Securities offered through Raymond James Financial Services, Inc., member FINRA/SIPC. Investment advisory services are offered through Raymond James Financial Services Advisors, Inc.

Center for Financial Planning, Inc. is not a registered broker/dealer and is independent of Raymond James Financial Services.

The foregoing information has been obtained from sources considered to be reliable, but we do not guarantee that it is accurate or complete, it is not a statement of all available data necessary for making an investment decision, and it does not constitute a recommendation. Any opinions are those of the author, and not necessarily those of Raymond James. Investing involves risk and you may incur a profit or loss regardless of strategy selected, including diversification and asset allocation. Keep in mind that individuals cannot invest directly in any index, and index performance does not include transaction costs or other fees, which will affect actual investment performance. Individual investor's results will vary. The S&P 500 is an unmanaged index of 500 widely held stocks that is generally considered representative of the U.S. stock market.

Center Clients Donate over $1 Million in Tax-Savvy QCD Strategy in 2023

Lauren Adams Contributed by: Lauren Adams, CFA®, CFP®

Print Friendly and PDF

We are proud to announce that The Center assisted clients in donating over $1,000,000 to charities using the Qualified Charitable Distribution (QCD) strategy in 2023!

The QCD strategy allows clients with assets in an IRA account and who are over age 70.5 to donate funds directly from their retirement account to a charity. Giving directly from an IRA to charity results in those dollar amounts not being included as taxable income for that year. That usually results in a lower tax bill for clients and can have positive downstream effects like lowering the amount they may pay for Medicare premiums and the portion of Social Security that is taxable to them, depending on their situation and income level. For those 73 or older, QCDs also count towards the distributions they need to take each year for their Required Minimum Distribution.

Now, there are some caveats for QCDs – for example, you need to be at least 70.5, and the charity must be a 501c3. There are also limits on how much you can give each year through this method, but that number is relatively high at $105,000 per person per year currently.

The Center’s mission is to improve lives through financial planning done right, and we are proud to be able to help clients make such a positive impact on the world (bonus points for it being in a tax-savvy manner!). 

Did you know that QCDs are only one of many charitable giving strategies our team helps clients deploy? Check out this video to learn more about ways our clients make their charitable dollars stretch further for the causes they care about while also potentially lowering their tax burden. 

As always, we recommend that you work with your tax preparer to understand how these strategies can affect your situation. If you want to explore these strategies and more, contact your Center financial planner today! 

Lauren Adams, CFA®, CFP®, is a Partner, CERTIFIED FINANCIAL PLANNER™ professional, and Director of Operations at Center for Financial Planning, Inc.® She works with clients and their families to achieve their financial planning goals.

The foregoing information has been obtained from sources considered to be reliable, but we do not guarantee that it is accurate or complete, it is not a statement of all available data necessary for making an investment decision, and it does not constitute a recommendation. Any opinions are those of Lauren Adams, CFA®, CFP® and not necessarily those of Raymond James. While we are familiar with the tax provisions of the issues presented herein, as Financial Advisors of RJFS, we are not qualified to render advice on tax or legal matters. You should discuss tax or legal matters with the appropriate professional.

Securities offered through Raymond James Financial Services, Inc., member FINRA/SIPC. Investment advisory services are offered through Raymond James Financial Services Advisors, Inc.

Center for Financial Planning, Inc. is not a registered broker/dealer and is independent of Raymond James Financial Services.