Investment Perspectives

Q2 2023 Investment Commentary

Print Friendly and PDF

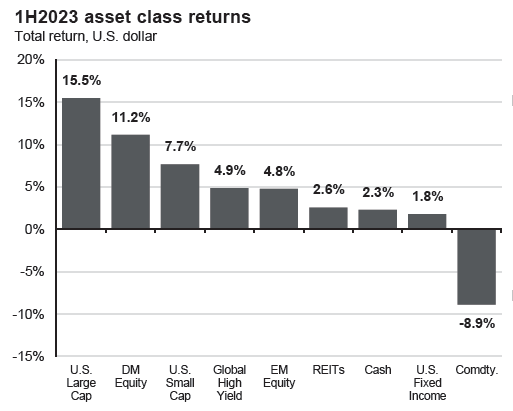
While Federal Reserve (the Fed) policy, macroeconomic headlines such as inflation, and geopolitical uncertainty are themes investors continue to hear about, U.S. large cap stocks finished the first half of 2023 up 15.5%. It is important to look under the hood of these returns as they have been entirely driven by the market's largest stocks, with the top 10 companies in the S&P 500 accounting for over 95% of gains. Beyond the largest companies, performance fell off quickly. Developed markets equity (International) has had notable returns year to date ending over 11% in positive territory for the year so far. While their returns struggled to eclipse the top 10 companies in the S&P 500, international investments handily outpaced the balance of the companies in the S&P 500. Commodities struggled the most as economies and production started to slow, and inflation is coming down (even though it is still elevated higher than we would like to see).


Much of the quarter was dominated by the banking sector headlines that cropped up at the end of the first quarter and debt ceiling negotiations in Washington. Two larger regional bank failures put the markets on edge, waiting for contagion to kick off this quarter. However, the backstop provided by the government and FDIC quickly seemed to curb potential contagion. Then all attention turned toward Washington dragging its feet over raising the debt ceiling, which led to intra-quarter volatility. As the U.S. government approached the date it was expected to run out of money to pay its bills, a deal was reached on June 1st to suspend the debt ceiling through January 2025 while cutting federal spending. As we mentioned in our previous commentary, this is the outcome that would likely occur as history has served as a guide for this. This agreement averted a U.S. government default ahead of the deadline.

The strong equity returns in the year's first half may have taken many by surprise. The question is, where do we go from here? Summer tends to be a time of weakness for markets, and a strong first half of the year could cause buyers to pause. It's not uncommon to see the market stop and gather itself and digest strong gains after they occur.

Higher interest rates

We have witnessed a large amount of excitement surrounding higher interest rates in CDs, money markets, and short-term treasuries. While this is great for money, we need to keep liquid for a shorter-term need or a place to park cash while implementing a dollar-cost averaging strategy; it is important to not give up on investing in a diversified portfolio. When rates were attractive in the early 2000s, it may have been tempting to divert some of your equity investments into cash equivalents rather than invest in the S&P 500 during a recession and continue with this throughout the years. But the opportunity cost is high. The chart below shows how investing $12,000 per year into equities, whether perfectly timed or the most poorly timed, outweighs diverting excess additions beyond need into cash equivalents. Even the worst timing over the years ended up well ahead of cash equivalents.

So, what has happened in the shorter term after times when CD rates peaked and seemed their most attractive? The chart below shows 12-month forward returns for different asset classes after rates peaked. While they may offer the added protection of FDIC insurance, notice that the 6-month CDs never returned more than the peak rate. This makes sense, as you are locking in a rate. The dark blue is the U.S. bond index, the light blue is high-yield bonds, and the green is the S&P 500. As you can see, the other asset classes returned far more than the CD rates 12 months after rates peaked in most of the periods shown below.


Again this reiterates the point not to allocate more than is appropriate for you into short-term fixed strategies.

Check out the video for an economic update!

This summer, all eyes will be on the next Fed decision when the FOMC meets at the end of July. In June, the Fed decided to pause and let the economy digest the drastic rate increases of 2022 and earlier this year. They did signal that we could likely see up to two more rate hikes this summer/fall. The U.S. economy still looks strong, so the FED feels they have room to continue to increase interest rates, even though at a much slower pace to get inflation under control. GDP growth worldwide continues to hold up, signaling we aren't in a recession yet (see the chart below). The Fed will continue to remain very data-dependent when determining their next steps, but the risk is rising that they will overtighten and push the economy into recession.

While the taxable bond yield curve remains strongly inverted, the Municipal bond yield curve is less inverted. This means that investors are better compensated for moving out longer in duration. For those in a higher tax bracket, municipal bonds can provide attractive taxable equivalent yields.

Continue to expect some volatility through the summer as markets digest hefty first-half returns, and we learn more regarding future interest rate action. A sound financial plan and regular rebalancing, when needed, help bring a portfolio through uncertain times. We are here to answer any questions you might have! Do not hesitate to reach out! Thank you for the trust you place in us each and every day!

Angela Palacios, CFP®, AIF®, is a partner and Director of Investments at Center for Financial Planning, Inc.® She chairs The Center Investment Committee and pens a quarterly Investment Commentary.

Any opinions are those of the Angela Palacios, CFP®, AIF® and not necessarily those of Raymond James. The information contained in this report does not purport to be a complete description of the securities, markets, or developments referred to in this material. There is no assurance any of the trends mentioned will continue or forecasts will occur. The information has been obtained from sources considered to be reliable, but Raymond James does not guarantee that the foregoing material is accurate or complete. Any information is not a complete summary or statement of all available data necessary for making an investment decision and does not constitute a recommendation. Investing involves risk and you may incur a profit or loss regardless of strategy selected. The S&P 500 is an unmanaged index of 500 widely held stocks that is generally considered representative of the U.S. stock market. The MSCI EAFE (Europe, Australasia, and Far East) is a free float-adjusted market capitalization index that is designed to measure developed market equity performance, excluding the United States & Canada. The EAFE consists of the country indices of 22 developed nations. The Bloomberg Barclays US Aggregate Bond Index is a broad-based flagship benchmark that measures the investment grade, US dollar-denominated, fixed-rate taxable bond market. Keep in mind that individuals cannot invest directly in any index, and index performance does not include transaction costs or other fees, which will affect actual investment performance. Individual investor's results will vary. Past performance does not guarantee future results. Diversification and asset allocation do not ensure a profit or protect against a loss. Investing involves risk and you may incur a profit or loss regardless of strategy selected. Past performance is not a guarantee or a predictor of future results. Raymond James and its advisors do not offer tax or legal advice. You should discuss any tax or legal matters with the appropriate professional.

Today’s Winners May Have Been Yesterday’s Losers

Print Friendly and PDF

The markets can be described as cyclical, volatile, and full of booms and busts. Often those cycles seem clear as day when looking back on them through history, but they are much harder to identify in real-time. And even when most investors seem to be on the same page about what point of its cycle an investment is in, there is no telling just how far that investment can continue to climb or fall before it turns around. If many investors agree that Nvidia is in a “bubble” at ~35x price to sales, but its stock price climbs another 100%...were they right?

That cyclical nature creates an unpredictable stream of winners and losers every year, but it is important to recognize that it is just that…unpredictable. Today’s winning investments very likely could have been yesterday’s losers. Here are a few recent examples:

  • Energy was the worst-performing sector in 2020 (down over 30% while the market was generally positive). Then from 2021 through 2022, it ran up an incredible 150% (the next closest was healthcare at +23%)

  • The financial sector was the worst performer in 2011 but the best performer in 2012.

  • Real estate was the worst sector in 2013 but the best in 2014.

This trend has been common throughout history. Does that mean we just cracked the code? Just buy the worst-performing sector from the prior year and profit! Well, that doesn’t always work out either:

  • Energy was the worst-performing sector in 2019 and also the worst-performing sector in 2020.

  • Communications was one of the worst in 2013 and again in 2014.

  • Financials were the worst in 2007, and again in 2008.

The uncomfortable fact about the markets is that they are unpredictable, risky, and do not always seem to make sense at the moment, but with that risk comes reward. Trying to time market cycles is a losing game. We believe in creating an approach that positions our clients for success through every boom and bust in their lifetime. No one knows WHEN those booms or busts are coming, but we do know that they will happen sooner or later, and we want you to be prepared either way.

Nicholas Boguth, CFA®, CFP® is a Portfolio Manager at Center for Financial Planning, Inc.® He performs investment research and assists with the management of client portfolios.

The information contained in this letter does not purport to be a complete description of the securities, markets, or developments referred to in this material. The information has been obtained from sources considered to be reliable, but we do not guarantee that the foregoing material is accurate or complete. Any opinions are those of Nick Boguth, CFA®, CFP®, and not necessarily those of Raymond James. Expression of opinion are as of this date and are subject to change without notice. There is no guarantee that these statement, opinions or forecasts provided herein will prove to be correct. Investing involves risk and you may incur a profit or loss regardless of strategy selected, including diversification and asset allocation. Individual investor’s results will vary. Past performance does not guarantee future results. Any information is not a complete summary or statement of all available data necessary for making an investment decision and does not constitute a recommendation.

Securities offered through Raymond James Financial Services, Inc., member FINRA/SIPC. Investment advisory services offered through Center for Financial Planning, Inc.® Center for Financial Planning, Inc.® is not a registered broker/dealer and is independent of Raymond James Financial Services.

Q1 2023 Investment Commentary

Print Friendly and PDF

The year has started much stronger than it may have felt so far. Growth-style investments trounced value-style investments as tech names came back into favor. International development beat U.S. while EM equity lagged, which was contributed by a weaker U.S. dollar. Small company stocks lagged large company stocks mainly due to a heavier technology exposure for large company indexes like the S&P 500. In contrast, the smaller company indexes had a heavier weighting in financials. The Morningstar asset allocation category of funds had 50-70% stock and 30-50% bonds, so on average, a 60% stock/40% bond allocation was up about 3.9% in the first quarter of the year.

Speaking of financials, Silicon Valley Bank (SVB), a lender to some technology companies and startups, became the largest bank to fail since 2008. Signature Bank became the 3rd largest bank to fail within hours of the SVB failure.  

How did they get to the point of failure? SVB was a commercial bank that specialized in servicing the venture capital community. Over the last few years, there has been much activity in venture capital fundraising, and many deposits flowed into the bank in late 2020 and 2021. SVB's balance sheet at this time went from $70 Billion to $200 Billion, while lending was only a fraction of what they did. So they had excess levels of liquidity and took most of that money to purchase treasuries. Their intention was to hold to maturity, so while they didn't have credit risk exposure, they had a lot of interest rate risk. During 2022 they experienced deposit outflows as venture capital companies were experiencing a lot of spending outflows and not as many inflows. At the same time, interest rates increased, causing unrealized losses in these bonds. As money continued to flow out of the bank, this caused a liquidity issue which forced the bank to sell treasuries at a loss to meet withdrawal demands. So ultimately, high amounts of interest rate risk and sector concentration were the main reasons for failure.

What about contagion? It's important to remember that banks do fail almost every year. Usually, they are caused by Fraud or mismanagement. But there are times when something bigger is going on that can cause multiple banks to fail. In the chart below you can see the largest amount of failures happened in the 1980s due to the farm crisis, oil prices, and the S&L crisis. The great recession was another big wave of bank failures.

In the case of the most recent failures, the government acted quickly over the weekend to create policies to back-stop banks that may need to sell treasuries to meet customer withdrawals. These policies allow banks to take cheap loans backed by those treasuries for a short term to meet depositor withdrawal demand if needed without booking losses.

Are my deposits with you covered by FDIC? We diligently review FDIC coverages for our clients. If you're unfamiliar with the Raymond James Bank Deposit program, here is a primer. One account at Raymond James through the Raymond James Bank Deposit Program (RJBDP) can provide up to $3,000,000 ($6,000,000 for joint accounts) of total FDIC coverage. Raymond James does the work behind the scenes as available cash is deposited into interest-bearing deposit accounts. RJ uses a waterfall process to ensure higher cash levels for clients than the traditional limits. With the Raymond James Bank Deposit Program, uninvested cash is deposited into interest-bearing deposit accounts at up to 20 banks, providing this increased FDIC eligibility.

Raymond James will deposit up to $245,000 ($490,000 for joint accounts of two or more) in each bank on a predetermined list. Another way to qualify for more coverage is by holding deposits in different ownership categories (account types such as an individual account, a trust account, and an IRA all qualify for their own FDIC coverage).

Is my money safe in Raymond James Bank? Questions about how Raymond James is positioned in this stressed environment? Watch this video.

Cash management is a much more active process than in the past. Short-term treasuries, Certificate of Deposits, and money market mutual funds offer attractive rates for the right investor. While these options don't carry FDIC coverage, they shouldn't be ignored. Talk to your advisor to explore what might be right for you if you're carrying large cash balances at your bank with no immediate need of utilizing the cash.

The U.S. government is close to its limit (Debt ceiling), where it can no longer borrow additional funds. Several months ago, Congress had to begin using "extraordinary measures" to fulfill some obligations, and the clock is ticking for them to be able to come to an agreement and raise the debt ceiling so that spending can continue without pause. Estimates show these measures run out as early as June. The issue is typical (see other times when the debt limit was raised in the graphic below), but a divided Congress can make the issue more contentious. The main holdup is that Republican opponents want to see spending cuts before the ceiling is raised, and spending cuts are not easy for anyone to agree upon. 

Expect volatility as deadlines to meet obligations approach and the market's price is in more uncertainty. The direct impact and potentially biggest worry for investors is the risk of the U.S. government defaulting on its Treasury debt. Additional pain in the form of spending cuts would have a direct economic impact, with uncertain outcomes and hard decisions being made on where to cut the spending. There is no way to predict the future, but history as a guide would suggest a deal is reached and the ceiling is once again raised as it has been every other time the issue has come up in our lifetimes. We lean on diversification, conservative portfolio positioning, and a sound financial plan during times of uncertainty, and we're always here to answer any questions you might have on the topic.

Is ESG Investing Political? Check out our upcoming webinar on April 19th!

Angela Palacios, CFP®, AIF®, is a partner and Director of Investments at Center for Financial Planning, Inc.® She chairs The Center Investment Committee and pens a quarterly Investment Commentary.

Any opinions are those of the Angela Palacios, CFP®, AIF® and not necessarily those of Raymond James. The information contained in this report does not purport to be a complete description of the securities, markets, or developments referred to in this material. There is no assurance any of the trends mentioned will continue or forecasts will occur. The information has been obtained from sources considered to be reliable, but Raymond James does not guarantee that the foregoing material is accurate or complete. Any information is not a complete summary or statement of all available data necessary for making an investment decision and does not constitute a recommendation. Investing involves risk and you may incur a profit or loss regardless of strategy selected. The S&P 500 is an unmanaged index of 500 widely held stocks that is generally considered representative of the U.S. stock market. Keep in mind that individuals cannot invest directly in any index, and index performance does not include transaction costs or other fees, which will affect actual investment performance. Individual investor's results will vary. Past performance does not guarantee future results. Diversification and asset allocation do not ensure a profit or protect against a loss. Investing involves risk and you may incur a profit or loss regardless of strategy selected. Past performance is not a guarantee or a predictor of future results.

What Goldman Sachs Thinks About Markets: Conference Key Takeaways

Jaclyn Jackson Contributed by: Jaclyn Jackson, CAP®

Print Friendly and PDF

Due diligence meetings are a core part of the Center’s investment research strategy.  They give us a chance to vet investment strategies for our clients. They also allow us to get data from global financial institutions and industry leaders that most advisors typically don’t have the resources to aggregate themselves. 

This fall, I attended the Professional Investor Forum at the Goldman Sachs Conference Center in New York. The three-day conference highlighted research from the company’s thought leaders about markets and the current economic landscape. 

Here are Goldman’s views on a few questions that have been top of mind for investors.

Q: Are we facing another “Great Recession”?

Investor anxiety is reminiscent of the Great Recession, but the root of market volatility is quite different. Market volatility in 2007-2008 was triggered by unhealthy company fundamentals, particularly in the financial sector. The volatility was micro-driven.

Current market volatility is macro-driven with inflation and fed policy expectations largely dictating the investor experience. Since company fundamentals are relatively healthy, Goldman believes a recession would be shallow – especially compared to the Great Recession.

Q:  What’s going on with equity markets?

Rates and higher bond yields have affected the US equity market. Today, the market trades at around 15 times forward earnings compared to 21 times forward earnings at the beginning of the year. A lot of this compression is coming from high growth companies, particularly “long-duration” tech companies where the valuation of the company is attributable to the earnings that are well into the future. 

The gap between shorter-duration stocks and longer-duration stocks has been very significant in terms of the relative performance. This is a tough environment for long-duration stocks because rates will likely stay high. Companies with more nearer-term visibility on their cash flows are likely to do better in this environment. (There are tech companies with more near-term visibility, so no need to dump all tech from your portfolio.)

Inflation clarity is important because that helps us understand the direction of Federal Reserve policy and interest rate policy. Greater investor confidence about corporate earnings might be the impetus for equity volatility to decline - freeing equity prices to move higher.

Equity markets are figured out when inflation is figured out.

Q: How low can equity markets go?

Goldman Sachs expects the inflation rate to lower and for markets to recover in late 2023. This is how they see the timeline unfolding:

  • The Fed will be raising rates several more times this year and early part of 2023.

  • At the end of the year, the S&P 500 will likely close somewhere between 3,400 and 3,600, modestly down from the current level.

  • Markets will be down in the early part of next year until we see inflation data trending lower.

  • Equity market moves higher by the end of 2023.

Note, there is a case to be made for a recession. In a recessionary scenario (where the Fed hikes so much that we move into recessionary territory), Goldman believes we could hit a low of around 3,150, which is meaningfully below where we are now.

Q: When will market volatility lighten up?

Goldman Sachs Economics expects the rate of inflation (as measured by core PCE) to decelerate from close to 5 percent to roughly 3 percent. If that actually happens, they believe equity prices will do okay. Nevertheless, that won’t be clear until sometime in the middle of 2023, so uncertainty will probably continue another six months.

Q:  Where should I be invested?

According to Goldman, we’ve move from a “there is no alternative” or TINA environment to a “there are reasonable alternatives” or TARA environment.

If investors wanted yield they would invest in equities, especially US equities. However, chasing yield through equities leaves the door open to greater risk vulnerability. With interest rates on short-term cash positions starting to approach 4 percent, investors can get an attractive rate of return from an income point of view. In the words of David Kostin, Goldman’s Chief US Equity Strategist, “the idea of pure cash returns pushing almost 4 percent and the expectation that the Fed Funds rate will be somewhere between 4.25 and 4.5 percent by the early part of next year, that would suggest that there are reasonable alternatives (to equities), just on the cash positions alone.”

To be clear, this does NOT mean one should sell all of their equities and buy short-term cash positions. Equity positions in your portfolio should generally align with your strategic allocation. This is suggesting that investors don’t have to take unwarranted risks with over-exposure to equity markets to get yield because there are reasonable alternatives (TARA). Short-term cash positions are one example of this. The key here is that now, investors don’t have to over-do-it with risks when looking for yields.

Fed tightening is a big focus, but other parts of financial conditions are tightening too - higher bond yields, wider credit spreads, stronger dollar, lower equity prices. All of these contribute to tightening financial conditions. The type of companies in the equity market that do well in this environment are companies with stronger balance sheets, companies with higher return metrics, return on equity, return on capital, companies with less drawdown in terms of their share prices, more stable growth in terms of different metrics. In short, “quality” companies are likely to help investors in the uncertain environment of tightening financial conditions.

Jaclyn Jackson, CAP® is a Senior Portfolio Manager at Center for Financial Planning, Inc.® She manages client portfolios and performs investment research.

The foregoing information has been obtained from sources considered to be reliable, but we do not guarantee that it is accurate or complete, it is not a statement of all available data necessary for making an investment decision, and it does not constitute a recommendation. Any opinions are those of the author, and not necessarily those of Raymond James. Investing involves risk and you may incur a profit or loss regardless of strategy selected, including diversification and asset allocation. Keep in mind that individuals cannot invest directly in any index, and index performance does not include transaction costs or other fees, which will affect actual investment performance. Individual investor's results will vary. The S&P 500 is an unmanaged index of 500 widely held stocks that is generally considered representative of the U.S. stock market. Standard deviation measures the fluctuation of returns around the arithmetic average return of investment. The higher the standard deviation, the greater the variability (and thus risk) of the investment returns. Performance of hypothetical investments do not reflect transaction costs, taxes, or returns that any investor actually attained and may not reflect the true costs, including management fees, of an actual portfolio. Changes in any assumption may have a material impact on the hypothetical returns presented. Illustrations does not include fees and expenses, which would reduce returns.

Part 2: Are International Equities Dead?

Nicholas Boguth Contributed by: Nicholas Boguth, CFA®

Print Friendly and PDF

In part 1 of this 2-part blog series, we discussed the importance of diversified investing despite the recent pain that many asset allocations have felt. We're now turning our attention to a key asset class when thinking about diversification…international stocks.

The S&P 500 (U.S. Large Stocks) returned over 14% annualized for the past ten years. The MSCI EAFE (International Large Stocks) returned a "mere" 7% annualized over the same period. 

This run of outperformance from U.S. stocks has been nothing short of astounding. Between the past outperformance and the current geopolitical conflict overseas, you might feel pressure to throw in the towel on international stocks and invest all of your money in the U.S. stock market. Still, we're here to share some perspectives on why that may not be to your benefit. 

My colleague, Jaclyn Jackson, CAP®, Senior Portfolio Manager and Investment Representative, RJFS, shared some research and statistics on the benefits of diversification in a total portfolio. Spreading bets across many asset classes has historically provided a smoother ride for investors and ultimately led to a higher expected value for portfolios.  

The same principle applies within asset classes. History has repeatedly shown that owning many types of stocks, rather than concentrating on one type of stock, may help maximize investors' chances of achieving return goals and limits the chances of major financial loss.

Beyond the timeless lesson from diversification, international stocks are trading at a larger discount to U.S. stocks than we've seen in a long time. History has also shown us that neither asset class has held a permanent premium when comparing U.S. to international. Lower valuations now suggest higher returns in the future, so valuation is a compelling story if you're looking for a reason to stick to your international allocation. 

Chasing performance is a significant pitfall of both novice and professional investors, but rarely leads to improved investment outcomes. The recent, prolonged outperformance of the U.S. stock market may make it tempting to think that the U.S. will continue to outperform indefinitely, but history suggests otherwise. We don't believe international equities are dead, and we'll continue to stick to the timeless practice of diversification in our portfolios.

Nicholas Boguth, CFA® is a Portfolio Manager at Center for Financial Planning, Inc.® He performs investment research and assists with the management of client portfolios.

The foregoing information has been obtained from sources considered to be reliable, but we do not guarantee that it is accurate or complete, it is not a statement of all available data necessary for making an investment decision, and it does not constitute a recommendation. Any opinions are those of Nick Boguth, CFA® and not necessarily those of Raymond James. Investing involves risk and you may incur a profit or loss regardless of strategy selected, including diversification and asset allocation. Keep in mind that individuals cannot invest directly in any index, and index performance does not include transaction costs or other fees, which will affect actual investment performance. Individual investor's results will vary.

The S&P 500 is an unmanaged index of 500 widely held stocks that is generally considered representative of the U.S. stock market. Standard deviation measures the fluctuation of returns around the arithmetic average return of investment. The higher the standard deviation, the greater the variability (and thus risk) of the investment returns.

The MSCI is an index of stocks compiled by Morgan Stanley Capital International. The index consists of more than 1,000 companies in 22 developed markets.

The MSCI EAFE (Europe, Australasia, and Far East) is a free float-adjusted market capitalization index that is designed to measure developed market equity performance, excluding the United States & Canada. The EAFE consists of the country indices of 22 developed nations.

Part 1: Are International Equities Dead?

Jaclyn Jackson Contributed by: Jaclyn Jackson, CAP®

Print Friendly and PDF

This is part one of a two-part blog series. We'll talk about diversification generally in this blog, then zoom in on international equity diversification during the second part of the series.

Amid geopolitical tension and pandemic backlash, equities have taken a beating; bond prices have fallen as the Fed raises rates, and even cash under the mattress is no match for inflation. Looking at our current market environment, I am reminded of the Motown classic sung by Martha and The Vandellas, "Nowhere to Run." For decades, investment professionals have preached the merits of asset allocation and portfolio diversification, but what do you do when it all stinks?

The answer is simple (but the action is hard): Stay the Course! That advice doesn't feel helpful during market turbulence, but honestly, it's the best advice for long-term investors. Let me explain…

Why Diversification Works

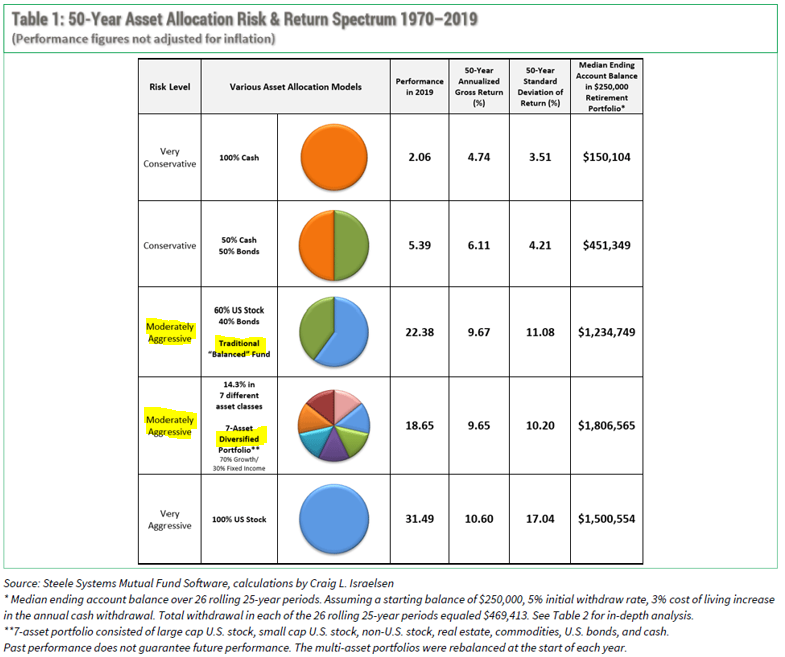
Craig L. Israelsen, Ph.D. and Executive-in-Residence in the Personal Financial Planning Program at Utah Valley, did compelling research around portfolio diversification worth reviewing. He compared five portfolios representing different risk levels and asset allocations over 50-years, from 1970 to 2019. While there is much to glean from his research, let's focus on his comparison of two moderately aggressive portfolios (as they most closely resemble the average investor experience):  

  • Traditional “Balanced” Fund: 60% US stock, 40% bond asset allocation

  • Seven Asset Diversified Portfolio: 14.3% allocation to seven different asset classes (asset classes included large U.S. stock, small-cap U.S. stock, non-U.S. developed stock, real estate, commodities, U.S. bonds, and cash)

In 2019, a year dominated by the S&P 500, the Traditional "Balanced" Fund (having a larger composition of the S&P 500) predictably outperformed Seven Asset Diversified Portfolio. On the other hand, over the 50-year period, the latter had a similar annualized gross return with a lower standard deviation. An investor with a diversified portfolio experienced comparable returns without taking as much risk.

Grounding his research in numbers, Israelsen evaluated a $250,000 initial investment for each portfolio over 26 rolling 25-year periods from 1970 to 2019 and assumed a 5% initial end-of-year withdrawal with a 3% annual cost of living adjustment taken at the end of each year. The Traditional "Balanced" Fund had a median ending balance of $1,234,749 after 25 years compared to the Seven Asset Diversified Portfolio median ending balance of $1,806,565.  

The research illustrates why planners have a high conviction in diversification. The Seven Asset Diversified Portfolio provided risk mitigation (as measured by standard deviation) and supported robust returns even with annual withdrawals.

Stay Tuned

We've discussed the merits of diversification in a general sense. In part two of the series, we'll speak more directly about international equities and explain why we believe it is still a diversifier worth holding.

Jaclyn Jackson, CAP® is a Senior Portfolio Manager at Center for Financial Planning, Inc.® She manages client portfolios and performs investment research.

The foregoing information has been obtained from sources considered to be reliable, but we do not guarantee that it is accurate or complete, it is not a statement of all available data necessary for making an investment decision, and it does not constitute a recommendation. Any opinions are those of Jaclyn Jackson, CAP®, and not necessarily those of Raymond James. Investing involves risk and you may incur a profit or loss regardless of strategy selected, including diversification and asset allocation. Keep in mind that individuals cannot invest directly in any index, and index performance does not include transaction costs or other fees, which will affect actual investment performance. Individual investor's results will vary.

The S&P 500 is an unmanaged index of 500 widely held stocks that is generally considered representative of the U.S. stock market. Standard deviation measures the fluctuation of returns around the arithmetic average return of investment. The higher the standard deviation, the greater the variability (and thus risk) of the investment returns.

Focusing on What You Can Control

Josh Bitel Contributed by: Josh Bitel, CFP®

Print Friendly and PDF

May is Mental Health Awareness Month, and as we all know, managing stress can go a long way in improving mental health. Personally, I have always been a bit of a “worry wart” and often have to remind myself not to sweat the small stuff and focus on what I can control. And of course, as a financial planner, I find this very easy to relate to investing and saving for retirement! Below is a graphic from J.P. Morgan that I have shared many times with clients. Just as we try to do in our personal lives, managing what we can control and not worrying about other factors can go a long way in relieving some of the stress that comes with saving for retirement.  

The major area that we as investors often become fixated on (and rightfully so!) is market returns. Ironically, as the chart shows, this is an area we have no control over. The same goes for policies surrounding taxation, savings, and benefits. As you can see, employment and longevity are things we do have some control over by investing in our own human capital and our health. In my opinion, the areas that we have total control over—saving vs. spending and asset allocation and location—are what we need to focus on. We try to have clients focus on consistent and prudent saving, living within (or ideally, below) their means, and maintaining a proper mix of stocks and bonds within their portfolio. Over the course of 35+ years of helping clients achieve their financial goals, The Center has realized that those two areas are the largest contributors to a successful financial plan. 

With so many uncertainties in the world we live in that can impact the market, it is always a timely reminder to focus on the areas we have control over and make sure we get those right. If we do, the other things that we might be stressing over will potentially fall into place. If you need help focusing on the areas of your financial well-being that you CAN control, give us a call! We are always happy to help.

Josh Bitel, CFP® is a CERTIFIED FINANCIAL PLANNER™ professional at Center for Financial Planning, Inc.® He conducts financial planning analysis for clients and has a special interest in retirement income analysis.

The foregoing information has been obtained from sources considered to be reliable, but we do not guarantee that it is accurate or complete, it is not a statement of all available data necessary for making an investment decision, and it does not constitute a recommendation. Any opinions are those of Josh Bitel, CFP® and not necessarily those of Raymond James.

Battle of the Brackets…Portfolio Management Edition: A Center Spin-Off Competition

Nicholas Boguth Contributed by: Nicholas Boguth, CFA®

Print Friendly and PDF

I believe certain things make our team outstanding here at The Center, and a few of them were in the spotlight this past month amid the March College Basketball Tournament:

In the spirit of education, teamwork, and some friendly competition, we ran a bracket competition with an investment focus (we did a normal bracket game too, but mine was busted the first day, so there is no need to talk about that). Every team member chose an asset class to represent their “team” in the tourney. The winner of each round is the asset class that outperformed over the week, and we are repeating for five weeks until we have our champion.

Some team members chose more stable asset classes like short-term U.S Treasuries or investment-grade bonds, while some chose more volatile options like Emerging Market stocks or commodities. Overall, it is fun for the entire team to collaborate and for all of us (not just those in investment roles) to watch how different asset classes move with economic news*.

*We all know there is no shortage of economic news lately from the U.S. and overseas. Markets have been volatile, and times like these stress the importance of having a plan in place. As always, we are here to help answer any questions you may have about your plan. One small but powerful tool in investment management that we have taken advantage of is tax-loss harvesting during volatile markets. Read more about that here.

The cherry on top of this competition is that we are playing for some of our favorite local charities. The Center’s Charitable Committee donated $1,000 to the winning four team members’ charities of choice. Check out the results from last year, as we ran the same competition using individual stocks instead of asset classes. We will continue to find new ways to collaborate, learn, and partner with charities here at The Center. We hope you follow our blog as we update along the way!

Nicholas Boguth, CFA® is a Portfolio Manager at Center for Financial Planning, Inc.® He performs investment research and assists with the management of client portfolios.

Any opinions are those of Nicholas Boguth, CFA® and not necessarily those of Raymond James. Every Investor’s situation is unique and you should consider your investment goals, risk tolerance and time horizon before making any investment, Prior to making an investment decision, please consult with your financial advisor about your individual situation.

Tips for Investors During Times of Market Volatility

Print Friendly and PDF

When faced with volatility in the market, emotions can be triggered in investors that can impact their judgment and potentially affect returns. These pullbacks can make folks want to pull up stakes and run – a reaction that is often a mistake, especially for long‐term investors.

The likelihood that we will continue to see volatility this year is high. The Fed has slowed down its bond buying activities and is raising interest rates, the threat of a new COVID variant that could shut down the economy still exists, and there are supply chain and labor issues around the globe. To top it all off, we are gearing up for mid‐term elections in November.

Here are some tips to consider when we do face a volatile market. Having a plan during this time can help provide clarity, confidence, and even strategies to take advantage of the volatility.

  • First, we need to remember that market volatility is normal. As investors, when we experience long periods of upward markets with little volatility, we forget how regular market volatility really is. We need to remember that historically, the market will dip by 5% at least three times a year. Also, on average, the market will have a 10% correction once a year. Understanding that volatility is a natural process of investing and challenging to avoid can help curb some emotions triggered by these markets.

  • Make sure your employer retirement accounts are rebalanced appropriately. Over the last few years, money invested in stocks have severely outperformed the bond market. Now is a good time to revisit the allocations in your Employer‐Sponsored Retirement plans to make sure your allocation is still within your risk tolerance. You will want to make sure that your allocation to stock funds and bonds funds is appropriate for the amount of risk you want to take. If you are unsure of how you should

  • Increase Plan contributions when markets are down. For younger investors still in the accumulation stage, a volatile market is a great time to increase your contributions. Though it may seem scary to increase your contributions when markets are volatile, you are actually buying into the market when prices are on sale. Contributions added when the market is down 5‐10% from the previous high have much more earning power than contributions made when the market is up 5‐10% from its last high.

  • Have additional cash on hand to invest in dips and corrections. For investors who have been able to max out their Employer‐Sponsored plans and still have additional cash to invest, a volatile market can make for an excellent opportunity to do so. Consider talking with your advisor about moving extra cash to your investment accounts to invest on dips and corrections. Together, you can develop a strategy to get your cash invested over time or all at once, depending on market conditions.

Stumbling through bad times without a strategy makes a troubling situation even worse. If you do not have a retirement or investment plan, you will not accurately assess the damage when markets do take a dive. This could increase stress and cause investors to make bad decisions.

These periods of volatility are an opportunity to connect with your advisor, enabling them to act as a sounding board for your concerns. By talking about current events in light of your overall financial plan, your advisor can provide a reassuring perspective to help you stay the course or even invest extra cash during an opportune time.

Michael Brocavich, MBA is a CERTIFIED FINANCIAL PLANNER™ professional at Center for Financial Planning, Inc.® He has an extensive background in both personal and corporate finance.

Investing involves risk and you may incur a profit or loss regardless of strategy selected, including diversification and asset allocation. The information has been obtained from sources considered to be reliable, but we do not guarantee that the foregoing material is accurate or complete. Past Performance does not guarantee future results.

Inflation Hedges Explored

Nicholas Boguth Contributed by: Nicholas Boguth, CFA®

Print Friendly and PDF

Our Director of Investments, Angela Palacios, recently wrote about the factors influencing current inflation rates. She shared a helpful chart from JPMorgan and summarized, “you may be surprised to see the strong average performance from varying asset classes in this scenario. Inflation that is reasonable and expected can be a very positive scenario for many asset classes.”

As the debate continues over whether or not inflation is “transitory,” some investors are thinking about how to protect their portfolios from rising inflation.

Most bonds, aside from TIPS, are generally expected to perform poorly if inflation rises. This should make sense as the fixed income stream from a bond investment will deteriorate if inflation rises. To protect against inflation, one might conclude that removing bonds from a portfolio makes sense, but not so fast. Bonds are typically in a diversified portfolio to protect from the more common (and devastating) risk – a stock market decline. Be sure to know how your portfolio’s risk exposure would shift before considering a move away from bonds.

Vanguard recently released some research on the topic of inflation hedging and concluded that commodities were the best asset class to protect from unexpected inflation. While commodities are generally accepted to be pretty good inflation hedges, one major risk of owning them has been on display for the past ten years. Their return stream can look significantly different than stocks’. Admittedly, this has been one of the best decades in history for U.S. stocks and one of the worst for commodities. To demonstrate just how “different” the returns can be, if you would’ve held one of the largest commodity ETFs over the past ten years, you would’ve underperformed the U.S. stock market by almost 400%.

Trailing 10-year performance of two ETFs that represent the U.S. stock market and the broad commodities market. SPY (green line) tracks the S&P 500, and DBC (blue line) tracks a basket of 14 commodities. Total return. Source: koyfin.com.

Trailing 10-year performance of two ETFs that represent the U.S. stock market and the broad commodities market. SPY (green line) tracks the S&P 500, and DBC (blue line) tracks a basket of 14 commodities. Total return. Source: koyfin.com.

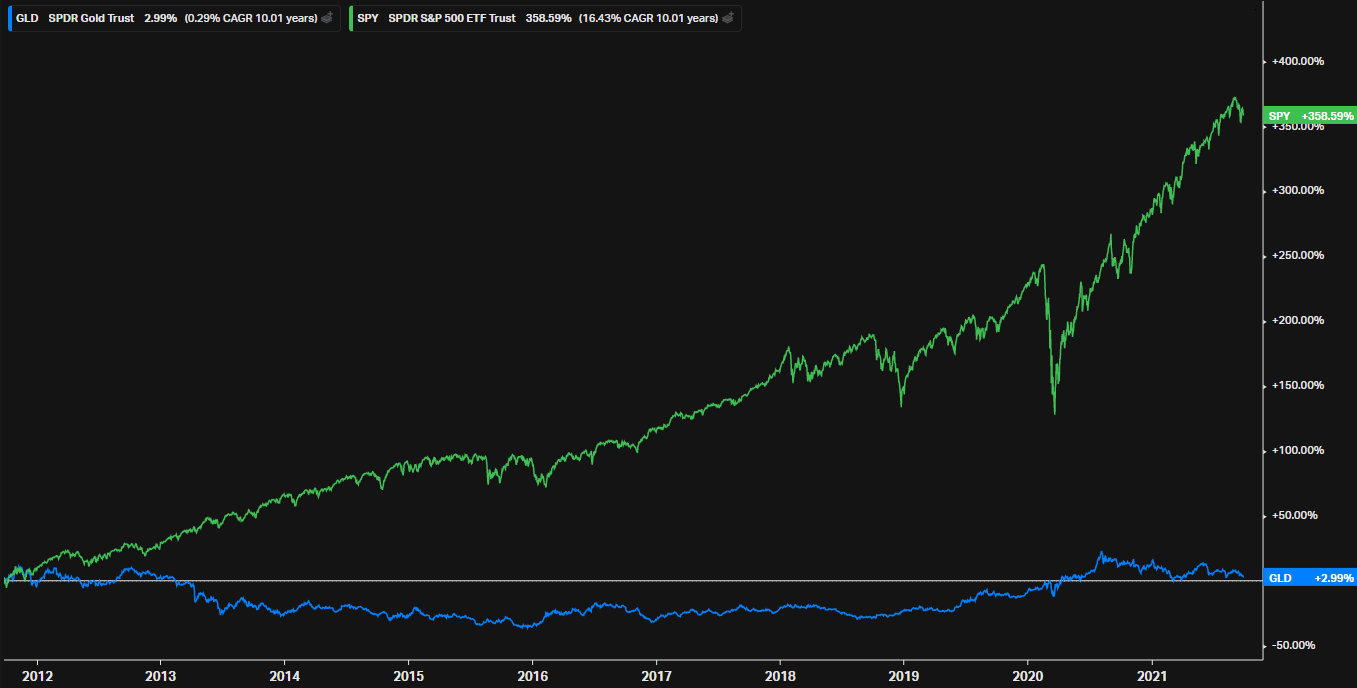
Some portfolio managers like Ray Dalio or First Eagle portfolio managers, Matthew McLennan and Kimball Brooker, have been long time proponents of gold as a hedge against inflation. Gold can be a powerful diversifier in a portfolio, but has also seen sustained periods of underperformance that may make it hard to hold over the long term. Here’s a similar chart of how a popular Gold ETF has performed over the past ten years compared to the red hot S&P 500.

Trailing 10-year performance of two ETFs that represent the U.S. stock market and the price of Gold. SPY (green line) tracks the S&P 500, and GLD (blue line) tracks the gold spot price. Total return. Source: koyfin.com.

Trailing 10-year performance of two ETFs that represent the U.S. stock market and the price of Gold. SPY (green line) tracks the S&P 500, and GLD (blue line) tracks the gold spot price. Total return. Source: koyfin.com.

You may even see articles claiming that bitcoin is the best inflation hedge to add to your portfolio. These opinion pieces make some compelling arguments, but it is important to remember that they are just opinion pieces; emphasis on opinion. We haven’t truly had an inflationary period since bitcoin became popular in the past decade, so there is no way of knowing if its performance has any correlation to U.S. inflation.

Above all else, before jumping to action on your portfolio, remember that inflation is quite hard to forecast. There are an infinite amount of moving parts and multiple ways to measure them. Professional forecasters don’t even agree on what it will look like in the next 12 months, let alone the next ten years or the remainder of your investment time horizon. One of the best ways to hedge against inflation is to talk to your financial advisor and understand how rising inflation might affect your financial plan. That is why we’re here.

Want to know what The Center thinks about inflation? Check out these resources: Inflation and Stock Returns and How Do I Prepare my Portfolio for Inflation.

Nicholas Boguth, CFA® is a Portfolio Administrator at Center for Financial Planning, Inc.® He performs investment research and assists with the management of client portfolios.

Opinions expressed are not necessarily those of Raymond James. The information has been obtained from sources considered to be reliable, but we do not guarantee that the foregoing material is accurate or complete. Past performance is not a guarantee of future results. Investing involves risk and investors may incur a profit or a loss. Treasury Inflation Protection Securities, or TIPS, adjust the invested principal base by the CPI-U at a semiannual rate. Rate of inflation is based on the CPI-U, which has a three-month lag. Bond prices and yields are subject to change based upon market conditions and availability. If bonds are sold prior to maturity, you may receive more or less than your initial investment. There is an inverse relationship between interest rate movements and fixed income prices. Generally, when interest rates rise, fixed income prices fall and when interest rates fall, fixed income prices rise. Investing in commodities is generally considered speculative because of the significant potential for investment loss. Their markets are likely to be volatile and there may be sharp price fluctuations even during periods when prices overall are rising. Gold is subject to the special risks associated with investing in precious metals, including but not limited to: price may be subject to wide fluctuation; the market is relatively limited; the sources are concentrated in countries that have the potential for instability; and the market is unregulated. Bitcoin issuers are not registered with the SEC, and the bitcoin marketplace is currently unregulated. Bitcoin and other cryptocurrencies are a very speculative investment and involves a high degree of risk.