Investment Planning

Investment risk is real. Every day. Every year. In up and down markets.

It is generally in good times – when, for example, US Equities are performing well  – that we all could use a friendly reminder like this:

The management of investment risk is constant in successful investing.     

Benjamin Graham, known as the “father of value investing”, dedicated much of his book, The Intelligent Investor, to risk.  One of his many timeless quotes states, “The essence of investment management is the management of risks, not the management of returns.”  This statement can be counterintuitive to many investors.  Risk does not have to be an alarm; rather a healthy dose of reality in all investment environments.

Our Take on Risk

How do we at The Center attempt to manage risk as stewards of approximately $850 million dollars? 

  •   Executing a defined investment process

  •   Individual investment policy statements

  •   Asset Allocation – both Strategic and Tactical

  •   Rebalancing guidelines

We have been managing client assets for over 28 years.  We fully understand and appreciate that investment returns are important. We also know that risk is an important element in constructing portfolios intended to fund some of life’s most important goals such as sending a child or grandchild to college, funding a long and successful retirement, having sufficient funds for long-term health needs, and passing a legacy to loved ones.  While no one can guarantee future investment returns, our experience suggests that those following our risk management tactics above may better stay on track with their financial plan. 

If you are a client, we welcome the opportunity to talk more about how your portfolio is constructed.  Not a client?  We’d enjoy the opportunity to share our experience and review your goals and risk.

Timothy Wyman, CFP®, JD is the Managing Partner and Financial Planner at Center for Financial Planning, Inc. and is a frequent contributor to national media including appearances on Good Morning America Weekend Edition and WDIV Channel 4 News and published articles including Forbes and The Wall Street Journal. A leader in his profession, Tim served on the National Board of Directors for the 28,000 member Financial Planning Association™ (FPA®), trained and mentored hundreds of CFP® practitioners and is a frequent speaker to organizations and businesses on various financial planning topics.

Investing involves risk and investors may incur a profit or a loss. Any opinions are those of Center for Financial Planning, Inc. and not necessarily those of Raymond James. C14-004278


Downside Hedging: The Diversified Portfolio Effect

 Wow, what a year for the markets in 2013!  Despite a rough end to 2012, uncertainty regarding the affordable care act and fiscal cliff, political tension in Syria and a government shutdown, U.S. stock markets surged and reached record highs.  When all was said and done, the Dow was up 26.5% and the S&P 500 rose by 29.6% for the year.  When you see numbers like that, you may think, “My accounts did very well this year, but they aren’t up close to 30%!”  That is a perfectly natural reaction. One reason you most likely did not see these types of returns is due to diversified asset allocation

Building a diversified portfolio using asset allocation can be tricky.  Let’s use a 60% stock, 40% bond portfolio as our example. Stocks are typically more risky and bonds tend to be more conservative and they often work inversely with one another.  When one is doing well, the other may be lagging.  This can help to even out returns and reduce the large swings in account values.  Within those two categories, one may see several different classes that comprise the 60% stock and 40% bond allocation. The stock side may include domestic large and small cap equities, international, emerging markets, energy, real estate, etc.  The bond side may include options such as short-term corporate debt, international, emerging markets or government bonds, etc.  The key is to build a portfolio that fits an investor’s individual long-term goals and needs so that the proper amount of stock and bonds can be utilized to help achieve those goals over different market conditions. 

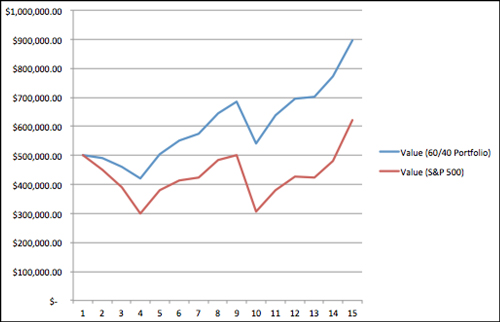
In the chart below, we compare a $500,000 portfolio that is invested in  60% stock, 40% bonds and one that is 100% invested in stocks, as represented by the S&P 500 from 2000 – 2013.  The results are pretty staggering.  As you can see, in years the market did well, the diversified 60/40 portfolio lagged the performance of the S&P 500.  This is something we would expect because of the portfolio’s exposure to bonds.  However, in years where the S&P 500 did very poorly, such as 2001 and 2008, the 60/40 portfolio was down significantly less compared to its counterpart.  The downside hedging is what I want to focus on.  When one loses 40% of their account values like many investors experienced in 2008, he or she would need to realize a 67% gain to get back to even.  It can take a very long time to recover such substantial losses like we saw in 2008.  Diversification is the main reason why the 60/40 portfolio is worth $272,000 more than the all-stock portfolio during the same time period.

Indices Used: S&P 500, MSCI EAFE, & Barclays Cap Agg


Sources: Barclays Cap Agg Indices, Standard & Poor’s Indices, MSCI EAFE, and Bloomberg Markets

The S&P 500 is an unmanaged index of 500 widely held stocks that is generally considered representative of the U.S. stock market. Individuals cannot invest directly in any index, and index performance does not include transaction costs or other fees, which will affect actual investment performance. Individual investor’s results will vary. Past performance does not guarantee future results. 

Let’s be honest – we all wish we could have the best of both worlds.  Who wouldn’t want to eat poorly, not exercise and still have that six pack?  The same can go for investing.  Many investors want to achieve 30% returns like we saw in 2013, but they don’t want to lose money in an environment where stocks decline 30%.  This is why The Center builds diversified portfolios for clients using asset allocation.  Asset allocation is not necessarily a “flashy” way of investing, nor does it get a dedicated nightly television show like Jim Cramer.  However, the lack of media attention has no bearing on its potential effectiveness for long-term, disciplined investing.  We understand and can empathize with clients when they are concerned that their accounts may not be participating in a market run up as much as they are seeing in the headlines. However, it is our job as your financial planning team to discuss the reasoning for this discrepancy and to help keep you focused on the long-term plan, which is what ultimately leads to investor confidence.

Nick Defenthaler, CFP® is a Support Associate at Center for Financial Planning, Inc. Nick currently assists Center planners and clients, and is a contributor to Money Centered and Center Connections.


Any information is not a complete summary or statement of all available data necessary for making an investment decision and does not constitute a recommendation. Prior to making an investment decision, please consult with your financial advisor about your individual situation. Any opinions are those of Center for Financial Planning, Inc. and not necessarily those of Raymond James. Diversification and asset allocation do not ensure a profit or protect against a loss. Investing involves risk and you may incur a profit or loss regardless of strategy selected. C14-003064

The January Barometer

 We’re off to an icy start, both in the weather and the markets. The weather forecast for this year has been cold, cold and colder in Michigan as well as across the country. It seems the temps are below zero more days than not this year.  Is it much the same in the forecast for the equity markets in 2014 or will they continue the sizzle of 2013?  As goes January so can go the rest of the year.  The chart below forecasts the likelihood of this:

As we finish the month of January with the S&P 500 down almost 3.5%, this means that we are more likely to have an overall negative calendar year than a positive one.  Our chances of being up overall this year are less than 42%.  Things could warm up though as the year progresses. Historical performance from February through the end of the years with negative Januarys have more often than not provided positive returns.

So even though the Groundhog saw his shadow predicting six more weeks of this harsh winter, it isn’t necessarily a given that the markets will remain icy. You’re probably familiar with the disclaimer, “Past performance is no guarantee of future returns.” Sticking with your long-term investment strategy amidst the noise and backward-looking statistics is the most important to the long-term achievement of your financial goals!

Angela Palacios, CFP®is the Portfolio Manager at Center for Financial Planning, Inc. Angela specializes in Investment and Macro economic research. She is a frequent contributor to Money Centered as well asinvestment updates at The Center.


Source: http://blogs.wsj.com/moneybeat/2014/01/31/morning-moneybeat-january-slump-is-nothing-to-fret/

The information has been obtained from sources considered to be reliable, but we do not guarantee that the foregoing material is accurate or complete. Any opinions are those of Center for Financial Planning, Inc. and not necessarily those of Raymond James. The S&P 500 is an unmanaged index of 500 widely held stocks that is generally considered representative of the U.S. stock market, that individuals cannot invest directly in any index, and index performance does not include transaction costs or other fees, which will affect actual investment performance. Individual investor’s results will vary. C14-003065

The Business Cycle: A Corporate Checklist

Making a list and checking it twice … Have you ever stopped to make a checklist just to be able to check things off you’ve already done?  I will admit I have done that on more than one occasion.  I love checklists, they keep me focused throughout the day at work and at home.  While corporations utilize checklists, they go by different names like agendas, goals or even vision statements.  Coming out of 2008, many corporations didn’t have a choice as to the items on their checklists.  They had to get financially healthier and fast because they were in the worst spot of the business cycle!  Following are some of the steps many corporations had to follow.

✔ Improve balance sheets by reducing the amount of outstanding debt

You can see the ratio of debt to equity is now below even long term averages.

Source: Standard & Poor’s Compustat, JP Morgan Asset Management

✔ Horde cash to be ready for the unexpected

Companies have nearly doubled the amount of cash on hand over the past decade.

Source: Standard & Poor’s Factset and JP Morgan Asset Management

✔ Buyback stock and increase dividends

Dividends paid are reaching record levels for the past decade and stock buybacks are getting close.

Source: S&P Dow Jones Indices

❍ Increase capital spending

Notice the final item on the checklist has yet to be checked.

Our economy is nearing the expansion/growth phase and this capital spending by companies is usually one of the later occurrences in the business cycle.  So, while I would love to check off the last item on the checklist (almost nothing makes me feel better) doing so could bring us closer to the next stage in the business cycle and closer to possible recession.

Angela Palacios, CFP®is the Portfolio Manager at Center for Financial Planning, Inc. Angela specializes in Investment and Macro economic research. She is a frequent contributor to Money Centered as well asinvestment updates at The Center.

The information contained in this report does not purport to be a complete description of the securities, markets, or developments referred to in this material, is not a complete summary or statement of all available data necessary for making an investment decision, and does not constitute a recommendation. The information has been obtained from sources considered to be reliable, but we do not guarantee that the foregoing material is accurate or complete. Any opinions are those of Center for Financial Planning, Inc. and not necessarily those of RJFS or Raymond James. Past performance may not be indicative of future results. Dividends are not guaranteed and must be authorized by the company’s board of directors. C14-002179

Bitcoin: The Open Source Currency

 Have you heard about Bitcoin? It’s an online “cryptocurrency” meaning it has no physical presence like the U.S. Dollar or similar currencies. Instead it’s simply a long sequence of random numbers and letters that’s supposed to be unique and not replicable. If you want to purchase something and the merchant on the other end of the transaction is willing to accept Bitcoins, you simply send that person Bitcoins through an online exchange.  An “electronic signature” is added (the random sequence of letters and numbers) which supposedly makes the transaction secure and not duplicable.  

How does someone get Bitcoins?

There are three ways to get Bitcoins.

  1. You can acquire Bitcoins by converting local currency (U.S. Dollars, Euro’s, British Pound Etc…) for Bitcoins on an online exchange. 
  2. If you are a merchant you can advertise that you accept Bitcoins for goods and services.
  3. Finally, you can “mine” for Bitcoins by dedicating your computer to the Bitcoin network. When your computer solves math problems, you earn Bitcoins. Anyone can take part but without a computer technology background, it can be extremely confusing. I candidly admit I don’t entirely understand it.  For further information:  http://www.bitcoinmining.com/

What is a Bitcoin worth?

The value of Bitcoins fluctuates dramatically on a day-to-day basis due to the emerging nature of the currency.  At the time of this writing 1 Bitcoin was worth $915.48 U.S. Dollars.  Unlike other currencies Bitcoin is not backed by the full faith and credit of any sovereign government so the “value” is only what the users are willing to pay for it.  

Where to store Bitcoin money?

There are several “wallets” currently available:

  1. Web wallets are stored on the world wide web, but apparently are less secure then other forms of wallets.
  2. Software wallets are downloaded and stored on your personal computer, and are considered more secure because the user has more control and doesn’t depend on a 3rd party service.
  3. Mobile Phone Wallets are available on iPhones and Android devices. 

How does someone spend Bitcoins?

Bitcoins can be spent anywhere that they are accepted. There are two commonly used websites to find Bitcoin-friendly merchants near you http://coinmap.org/ and https://bitpay.com/directory#/#search   .   By current estimates there are over 12,000 vendors that accept Bitcoins.  

Where to find more information? 

Here are some good places to keep up with Bitcoin news and discussion:

  • Coindesk.com - An excellent source of Bitcoin news
  • BitcoinMagazine.com - Insightful articles with deep technical credentials
  • BitcoinX.com - Bitcoin headlines, market rates & charting resources

Matthew Trujillo is a Registered Support Associate at Center for Financial Planning, Inc. Matt currently assists Center planners and clients, and is a contributor to Money Centered.


This article and its links are being provided for information purposes only.  It is not a recommendation to buy or sell Bitcoins.  Raymond James is not affiliated with and does not endorse, authorize or sponsor any of the listed websites or their respective sponsors.  Raymond James is not responsible for the content of any website or the collection or use of information regarding any website’s users and/or members. #C14-001113

Can You Ignore the Facebook Speculation?

 If you’re tapped into social media, you’ve likely heard the latest hype about Facebook’s share prices. Facebook has drawn a lot of attention and, as a result, a lot of demand for its underlying common stock. 

How Facebook is Valued

There are a lot of different methods for valuing shares in publicly traded companies.  Two of the more common approaches are to look at present earnings versus the current share price and decide whether a company is under or overvalued based on some multiple of those two figures. This is known as the price to earnings ratio.  The second common approach, and probably the one more applicable to social media companies, is future projected price to earnings. This approach is nothing more then educated guess work, and in many cases can lead investors to pay large dollar amounts for a company based on their potential earnings rather than current earnings.

The argument is that because social media sites have so many users, they can leverage that user base into advertising dollars. It sounds great, in theory, and even in practice we are starting to see those advertising dollars roll in for Facebook. The company recently reported $2.02 billion of revenue for the third quarter of 2013.  That’s certainly a lot of money, but if you take a look at what that means in the bigger picture that’s simply .39 cents for each share they have outstanding.  If you were to purchase Facebook’s stock today, you would be paying almost 150 times their earnings.  The closing price on January 13th, 2014, was $56.46 per share.

Even if you account for future potential earnings, Facebook would have to triple their revenue to bring their multiples down to any sort of reasonable historical P/E ratio (according to Morningstar.com, S&P 500 companies have a historical P/E ratio of roughly 15). Furthermore, a future tripling of revenue would only justify the current price. For any further appreciation of the share price, the growth would have to continue at an exponential rate, which seems highly unrealistic, even by Facebook standards.  

Technology Craze Notables

Despite all this, don’t be surprised if Facebook’s share price continues to rise in the short term.  It’s widely documented from the 1999-2000 technology craze that companies share prices appreciated substantially regardless of their underlying fundamentals or profitability.  You may or may not remember some of these under-achievers from that time period: 

  • Boo.com -- spent $188 million in just six months n an attempt to create a global online fashion store that went bankrupt in May 2000.        
  • Broadcast.com -- acquired by Yahoo! for $5.9 billion in stock, making Mark Cuban a multi-billionaire.  The site is now defunct and redirects to Yahoo!'s home page.
  • Freeinternet.com – Filed for bankruptcy in October 2000, soon after canceling its initial public offeringISP in the United StatesBaby Bob, the company lost $19 million in 1999 on revenues of less than $1 million.
  • GeoCities – Purchased by Yahoo! for $3.57 billion in January 1999.  Yahoo! closed GeoCities on October 26, 2009.
  • theGlobe.com -- social networking service that went live in April 1995 and made headlines by going public on November 1998 and posting the largest first day gain of any IPO in history up to that date.       
  • inktomi – Valuation of $25 billion in March 2000.
  • InfoSpace – In March 2000 this stock reached a price $1,305 per share, but by April 2001 the price had crashed down to $22 a share.
  • MicroStrategy -- shares lost more than half of their value on March 20, 2000, following their announcement of re-stated financials for the previous two years.  A BusinessWeek editorial said at the time, "The company's misfortune is a wake-up call to all dot-com investors.  The message:  It's time, at last, to pay attention to the numbers."
  • Xcelera.com – Swedish investor in start-up technology firms that was one of the "greatest one-year rise of any exchange-listed stock in the history of Wall Street." 

If there’s one take-away from this list it is this: Short-term speculation is no different than gambling and can end badly.  In the end, fundamentals usually win. As legendary investor Warren Buffet so aptly put it, "The line separating investment and speculation, which is never bright and clear, becomes blurred still further when most market participants have recently enjoyed triumphs. Nothing sedates rationality like large doses of effortless money.”

Matthew Trujillo is a Registered Support Associate at Center for Financial Planning, Inc. Matt currently assists Center planners and clients, and is a contributor to Money Centered.


The information contained in this report does not purport to be a complete description of the securities, markets or developments referred to in this material, and is not a complete summary or statement of all available data necessary for making an investment decision, and does not constitute a recommendation or a solicitation or an offer to buy or sell any security referred to herein.  The information has been obtained from sources considered to be reliable, but we do not guarantee that the foregoing material is accurate or complete.  Any opinions are those of Center for Financial Planning, Inc., and not necessarily those of RJFS or Raymond James.  Expressions of opinion are as of this date and are subject to change without notice.  The price-earnings ratio, or P/E, is a common measure of the value of stocks.  It shows the relationship between a stock’s prices and the underlying company’s earnings (or profits) per share of stock.  In essence, it calculates how many dollars you pay for each dollar of a company’s earnings.  In very general terms, the higher the P/E ratio, the more likely the stock is to be overpriced.  Forward P/E, sometimes called estimated P/E, divides a stock’s current price by consensus earnings estimates for the next four quarters.  It evaluates the current stock price against projected earnings.  Forward P/E will be lower than current P/E if earnings are projected to rise, and higher if future earnings are expected to slow. Links are being provided for information purposes only.  Raymond James is not affiliated with and does not endorse, authorize or sponsor any of the listed websites or their respective sponsors.  Raymond James is not responsible for the content of any website or the collection or use of information regarding any website’s users and/or members.  Center for Financial Planning, Inc., Raymond James Financial Services, Inc., its affiliates, officers, directors or branch offices may in the normal course of business have a position in any securities mentioned in this report.  Closing price for Yahoo as of 1/13/14 was $40.21/share.  Google and Yahoo are not closely followed by Raymond James Research.  #C14-000640

One of the Biggest Investing Mistakes for Women

There is so much information out there for women about investing … news stories, case studies, research reports, white papers and books try to answer common investment questions.  But this well-intentioned information should come with a warning label: Lumping women investors together in one big category is a cliché’ to be avoided at all costs

Similar But Not the Same

While the similarities among women investors can be significant, cookie cutter advice is not specific enough to rely on over the long term. Over the last 20 years I have had the pleasure of working with many women with backgrounds as diverse as snowflakes. A couple of common themes I see working with women investors is a high degree of importance placed on the personal connection with an advisor, and an intuitive sense that links investment decisions to heartfelt priorities including family and charitable causes.

Differences Abound

Differences are also abundant and unique to each individual.  For example, a woman in her 50’s who is immersed in her career and has launched children is in a different place than a woman who is recently widowed or divorced.  Even women who have achieved similar career goals cannot be lumped together.  Some have built investment savvy along the way and some have not.  The real work begins with the discovery of how each woman investor is different from other women even when they share general characteristics.   

Creating Your Vision

Discovery starts with a personal vision that is linked to your unique financial life planning.   Vision implies you have a view of exactly where you want to go and you chart a course accordingly. It’s like plotting a journey on a map – straightforward with no distractions or alternate routes.  The reality is that, for many women, the vision diverges into quite a lot of directions.  It is at these points where the advisor you work with really can make a difference.

Hitting mile markers where life and money intersect including career changes, divorce, loss of a spouse or retirement are all opportunities to regroup resources, refocus on the vision, and move forward with plans for the future.  Avoiding clichés associated with being a woman investor is an important part of the process. 

Laurie Renchik, CFP®, MBA is a Senior Financial Planner at Center for Financial Planning, Inc. In addition to working with women who are in the midst of a transition (career change, receiving an inheritance, losing a life partner, divorce or remarriage), Laurie works with clients who are planning for retirement. Laurie was named to the 2013 Five Star Wealth Managers list in Detroit Hour magazine, is a member of the Leadership Oakland Alumni Association and in addition to her frequent contributions to Money Centered, she manages and is a frequent contributor to Center Connections at The Center.

Five Star Award is based on advisor being credentialed as an investment advisory representative (IAR), a FINRA registered representative, a CPA or a licensed attorney, including education and professional designations, actively employed in the industry for five years, favorable regulatory and complaint history review, fulfillment of firm review based on internal firm standards, accepting new clients, one- and five-year client retention rates, non-institutional discretionary and/or non-discretionary client assets administered, number of client households served.

Any opinions are those of Center for Financial Planning, Inc., and not necessary those of Raymond James. #C13-002513

How to Make Net Unrealized Appreciation Work for You

The financial planning profession is full of acronyms such as RMD, IRA, TSA and NUA.  One acronym making a comeback due to the increase in the US Equity market is “NUA”.  NUA stands for net unrealized appreciation and anyone with a 401k account containing stock might want to better understand it.  NUA comes into play when a person retires or otherwise leaves an employer sponsored 401k plan.  In many cases, 401k funds are rolled over to an IRA.  However, if you hold company stock in the 401k plan, you might be best served by rolling the company stock out separately. 

Before getting to an example, here are the gory details: The net unrealized appreciation in securities is the excess of the fair market value over the cost basis and may be excluded from the participant's income. Further, it is not subject to the 10% penalty tax even though the participant is under age 59-1/2, since, with limited exceptions; the 10% tax only applies to amounts included in income.  The cost basis is added to income and subject to the 10% penalty, if the participant is under 59.5 and the securities are not rolled over to an IRA.

Suppose Mary age 62 works for a large company that offers a 401k plan.  Over the years she has purchased $50,000 of XYZ company stock and it has appreciated over the years with a current value of $150,000.  Therefore, Mary has a basis of $50,000 and net unrealized appreciation of $100,000. 

If Mary rolls XYZ stock over to an IRA at retirement or termination, the full $150,000 will be taxed like the other funds at ordinary income tax rates when distributed.  However, if Mary rolls XYZ stock out separately the tax rules are different and potentially more favorable.  In the example above, if Mary rolls XYZ out she will pay ordinary income tax immediately on $50,000 but may obtain long term capital treatment on the $100,000 appreciation when the stock is sold; thus potentially saving several thousand dollars in income tax.

A NUA transaction is complex so care and professional guidance is encouraged.   

Timothy Wyman, CFP®, JD is the Managing Partner and Financial Planner at Center for Financial Planning, Inc. and is a frequent contributor to national media including appearances on Good Morning America Weekend Edition and WDIV Channel 4 News and published articles including Forbes and The Wall Street Journal. A leader in his profession, Tim served on the National Board of Directors for the 28,000 member Financial Planning Association™ (FPA®), trained and mentored hundreds of CFP® practitioners and is a frequent speaker to organizations and businesses on various financial planning topics.

The information contained in this report does not purport to be a complete description of the securities, markets or developments referred to in this material, is not a complete summary or statement of all available data necessary for making an investment decision, and does not constitute a recommendation.  The information has been obtained from sources considered to be reliable, but we do not guarantee that the foregoing material is accurate or complete.  Any opinions are those of Center for Financial Planning, Inc., and not necessarily those of RJFS or Raymond James.  You should discuss any tax or legal matters with the appropriate professional.

A Well-timed Time-out

 Growing up, my sport of choice through high school and college – or at least the sport I didn’t get cut from in tryouts -- was Golf.  The term sport is, I think, loosely applied to the game of golf.  Anything you can do while eating, drinking and socializing sounded like my kind of sport.  While golf isn’t the type of sport you take a time-out in, I still learned to recognize the value a time-out can offer.  A time-out gives you a chance to catch your breath, look around and assess the situation.

Recently I took a time-out from my daily duties at The Center to attend a conference in Chicago that gathered some excellent investment managers in one place to discuss current investing themes. One presentation summarized cleanly a theme our investment committee has been working on for the past several months…investing around the world (especially in Europe).  It has been compelling to us because the EU recovery lags behind the rebound the United States has enjoyed.  With headlines as seen below it appears there could be an excellent investment opportunity for certain investors.

Source: Harris Associates L.P.

When headlines are at their worst, investment opportunity is usually at its greatest. Europe emerging from their recession could have a strong positive impact on international equities in general.  So take a time-out to notice what is happening on the international front. While other investors aren’t slowing their game, take a moment to step back and assess. A time-out can be an excellent tool to uncover investment opportunities.

Angela Palacios, CFP®is the Portfolio Manager at Center for Financial Planning, Inc. Angela specializes in Investment and Macro economic research. She is a frequent contributor to Money Centered as well asinvestment updates at The Center.


The information contained in this report does not purport to be a complete description of the securities, markets or developments referred to in this material.  Any information is not a complete summary or statement of all available data necessary for making an investment decision and does not constitute a recommendation.  Any opinions are those of Center for Financial Planning, Inc., and not necessarily those of RJFS or Raymond James.  International investing involves special risks, including currency fluctuations, differing financial accounting standards, and possible political and economic volatility.  Investing involves risk and investors may incur a profit or loss.

An Economic Perspective: Housing on the Mend with Little Sign of Concern

 Housing, as an industry, during the last down cycle beginning in 2007 went through the mother of all housing bear markets. We all know the problems that relaxed lending standards and cheap money caused. Many are wondering if it will happen again.

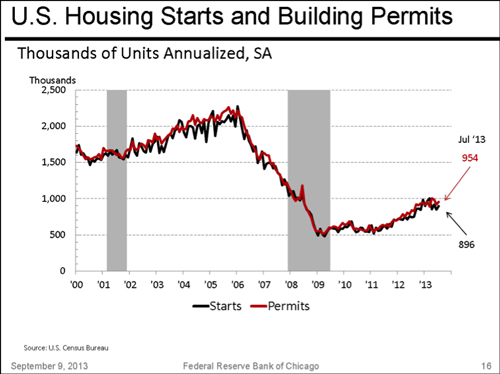
New housing permits and housing starts are moving strongly upward again (as shown below). But it took a while to work through the overhead supply that was sitting on the marketplace. In 2007, there were 4.3 million homes on the market in the US.  That number has dropped to 2.3 million homes over the last 6 years.

The US economy requires about 1.4 million new units a year for:

  1. New home owners (demographics)
  2. Demolitions (replacement of old homes) 

But only about 900,000 new homes are being built annually.  We are continuing to cut through that supply in the market place.  At this rate there will not be a home left to purchase in America in about 5 years.

So, I would say that we are already at what historically looks like a tight supply market (which usually impact prices). As shown on the “Home Prices” chart below, we are seeing that as prices go up all across the country.  Over the last 12 months prices have increased some 20% nationally according to the Case-Shiller index.

Furthermore take into consideration the still encouraging “affordability index” which indicates that it’s still cheaper to buy than rent (as shown above). We believe All signs indicate we have a bull market in housing underway without the same ominous signs we saw at the end of the last housing bull market.

Matthew E. Chope, CFP ® is a Partner and Financial Planner at Center for Financial Planning, Inc. Matt has been quoted in various investment professional newspapers and magazines. He is active in the community and his profession and helps local corporations and nonprofits in the areas of strategic planning and money and business management decisions. In 2012 and 2013, Matt was named to the Five Star Wealth Managers list in Detroit Hour magazine.


Five Star Award is based on advisor being credentialed as an investment advisory representative (IAR), a FINRA registered representative, a CPA or a licensed attorney, including education and professional designations, actively employed in the industry for five years, favorable regulatory and complaint history review, fulfillment of firm review based on internal firm standards, accepting new clients, one- and five-year client retention rates, non-institutional discretionary and/or non-discretionary client assets administered, number of client households served.

The information contained in this report does not purport to be a complete description of the markets or developments referred to in this material, and is not a complete summary or statement of all available data necessary for making an investment decision, and does not constitute a recommendation.  The information has been obtained from sources considered to be reliable, but we do not guarantee that the foregoing material is accurate or complete.  Any opinions are those of Center for Financial Planning, Inc., and not necessarily those of RJFS or Raymond James.  Past performance may not be indicative of future results.  Be sure to contact a qualified professional regarding your particular situation before making an investment decision.