Investment Planning

Black Monday? How about Ruby Tuesday?

 Most investors are familiar with the infamous “Black Monday” stock market crash.   The Dow Jones Industrial Average (DJIA) dropped by a whopping 22.61% in one day on Monday October 19, 1987.  Many may not be as familiar with records that are being set right now for Tuesdays.  May 28th marked the 20th Tuesday in a row where the Dow Jones Industrial Average ended on an up note.  This is a record breaking streak of gains for any specific day of the week in the history of the DJIA.  The previous high count was 13 days in a row and has occurred on 3 separate occasions for Monday, Wednesday and Friday with the most recent streak occurring in 1900! 

This Tuesday winning streak that began on January 15th has included 1,573 points for the Dow or 83% of the years gains for the index as of May 28th.  The picture below is a total of Year to date points made or lost cumulatively on the particular day of the week for the DJIA. 

http://buzz.money.cnn.com/2013/06/04/dow-tuesday-streak/

There has been much speculation as to why Tuesday has been so great? 

Here are some of the arguments.

  • The federal reserve is buying bonds through their open market operations on Tuesday and Friday’s
  • Retail investors placing mutual fund buy orders on Monday, after looking at their accounts over the weekend, and then the managers are putting that money to work on Tuesday.
  • Automated trading programs that seek out trends have noticed this trend and started to buy in anticipation, and as such, perpetuating the trend.
  • Or it could just be random

While the debate of why this phenomenon has occurred may not be over, unfortunately, the winning streak itself is over as of Tuesday June 4th.

http://www.bespokeinvest.com/thinkbig/2013/5/28/20-for-tuesday.html

Angela Palacios, CFP®is the Portfolio Manager at Center for Financial Planning, Inc. Angela specializes in Investment and Macro economic research. She is a frequent contributor to Money Centered as well asinvestment updates at The Center.


The information contained in this report does not purport to be a complete description of the securities, markets, or developments referred to in this material. The information has been obtained from sources considered to be reliable, but we do not guarantee that the foregoing material is accurate or complete. Any information is not a complete summary or statement of all available data necessary for making an investment decision and does not constitute a recommendation. The Dow Jones Industrial Average (DJIA), commonly known as “The Dow” is an index representing 30 stock of companies maintained and reviewed by the editors of the Wall Street Journal. Keep in mind that individuals cannot invest directly in any index, and index performance does not include transaction costs or other fees, which will affect actual investment performance. Individual investor's results will vary. Past performance does not guarantee future results.

CNBC Ratings as a Leading Indicator?

 This may be the most unique candidate for a leading indicator I’ve run across in a long time.  A leading indicator is defined as a measurable economic factor that changes before the economy starts to follow a particular pattern or trend.  You may have heard of an inverted yield curve predicting recessions or the number of building permits applied for predicting a housing boom or bust.

How about CNBC viewership predicting the next stock market boom or bust?  Below is a chart showing Nielson Ratings for CNBC over the last eight years.  The last time their ratings were this low was 2005 when markets had stablized after the tech bubble burst and we had enjoyed a couple of years of good returns.  Sound familiar?

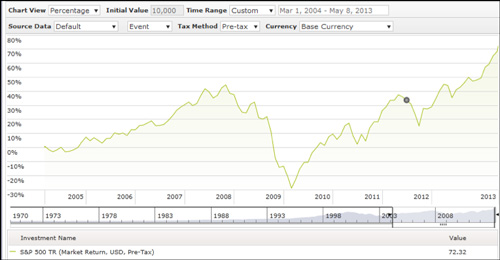
As you can see in the chart below of the S&P 500 total returns, 2005 was the start of some very nice returns which continued for the next few years.  Could the low viewer ratings be a potential indicator that the returns we have experienced since 2009 are just the beginning?  As returns accelerated toward the market peak in 2007 so did CNBC’s ratings into 2007. 

Data from Morningstar

As individual investors start to jump on the band wagon of a bull market run, they become more interested in what is happening to their money and thus turn on the news.

There are many reasons investors could be choosing not to watch the channel now:

  1. Investors have been lulled into a sense of security about market returns and aren’t concerned about current events
  2. Many are not actually invested in the markets; therefore, they do not care
  3. Investors are finding their information elsewhere
  4. They have grown tired of the sensationalizing the network does to try to get better ratings (which is actually my main reason for not watching)

Assuming investors aren’t watching anymore because of one of the first two reasons, then this could be a very good indicator of what is to come, potential positive returns as more individuals put money back to work in the markets.

It is too bad there isn’t much historical data to determine if this is, indeed, a good stock market indicator but it is definitely something from CNBC that is much more interesting to follow than their overly dramatic, TV personalities!

Angela Palacios, CFP® is the Portfolio Manager at Center for Financial Planning, Inc. Angela specializes in Investment and Macro economic research. She is a frequent contributor to Money Centered as well as investment updates at The Center.


Any opinions are those of Center for Financial Planning, Inc., and not necessarily those of RJFS or Raymond James.  Any information is not a complete summary or statement of all available data necessary for making an investment decision and does not constitute a recommendation.  Keep in mind that individuals cannot invest directly in any index, and index performance does not include transaction costs or other fees, which will affect actual investment performance.  Individual investor’s results will vary.  Past performance may not be indicative of future results.

Is Your Portfolio Off to the Races?

 We just got to enjoy what has been called “The Greatest Two Minutes in Sports.”  I have always been a fan of the Kentucky Derby, the horses, the outrageous hats, wondering who is wearing the hats, and a blanket of roses.  I’ve had the privilege of actually going down to Louisville to watch but I have never been part of the glamorous, hat-wearing crowd. We’ve always watched from the infield, though “watch” is a loose term. It is more like standing on your tip toes to see a blur of horses run by you for about one-tenth of a second and then return to drinking your mint julep.  But it is fun nonetheless. 

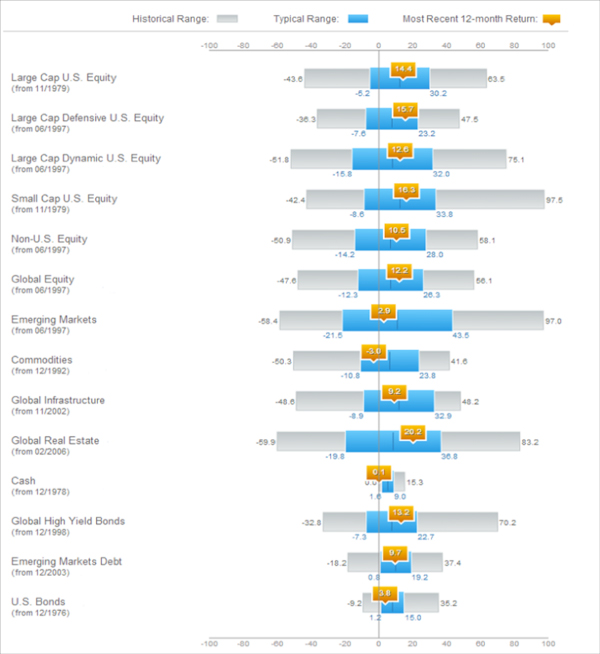
This year the market has felt a lot like we have been off to the races.  It has been one of the strongest starts to the year this decade.  Is it too much too fast?  A new chart put out by Russell Investments says maybe not.


For additional disclosure and interpretive guidance on this chart, please click on the following link: http://www.russell.com/Helping-Advisors/Markets/acd.aspx?d=t 

How to interpret the chart:

  1. The gray bar is the full range of 1 year returns the asset class has experienced throughout history
  2. The blue portion of the bar is where returns fall most of the time (68%)
  3. The number highlighted in orange is where returns fell for the 12 months that ended as of March 31st, 2013

Even with the strong returns, as of recently, most indexes are still hovering near “middle of the road” returns for the past 12 months.  So perhaps it hasn’t been too much too quickly.

If you are seeking some advice on an appropriate strategy for your portfolio, put the odds in your favor and contact your Financial Planner today!

Angela Palacios, CFP®is the Portfolio Manager at Center for Financial Planning, Inc. Angela specializes in Investment and Macro economic research. She is a frequent contributor to Money Centered as well asinvestment updates at The Center.


The information has been obtained from sources considered to be reliable, but we do not guarantee that the foregoing material is accurate or complete.  Links are being provided for information purposes only.  Raymond James is not affiliated with and does not endorse, authorize or sponsor any of the listed websites or their respective sponsors.  Raymond James is not responsible for the content of any website or the collection or use of information regarding any website’s users and/or members.

My Meetings with Some of Our Portfolio Managers and Their Teams

 Over the last 22 years I have come to realize on many occasions that we are not in the numbers business but in the people business.  Clients like to know that we understand their investments, and more importantly, the people behind the investments.  While numbers are crucial and we spend a lot of time in the depths of many calculations, I find the most value when I get to understand the people behind the numbers. 

Recently, I met with many of the managers from the PIMCO family of funds.  PIMCO has been a long time resource, providing portfolio management services for the funds of Center clients for over a decade. I alone have made this trip 3 times in the last 10 years while others from the Center have also made the trip. These onsite visits take time, usually a day of travel to their offices and back and many hours of sitting, talking and listening to their strategies, philosophies and themes.  I listen to their logic, really  like to see that passion that drives them to succeed for Center clients.

I joke with our investment department about passion, “The managers we want jump out of bed like a piece of toast in the morning to get to work.”  These managers could retire but they would prefer to manage money rather than golf.  I always find these meetings with our managers as worthy time spent.  I have come back from meetings with conviction in people and their teams we have in place and sometimes found that we need to look elsewhere for a replacement.

Some things can’t be discerned in the numbers alone.

Matthew E. Chope, CFP ® is a Partner and Financial Planner at Center for Financial Planning, Inc. Matt has been quoted in various investment professional newspapers and magazines. He is active in the community and his profession and helps local corporations and nonprofits in the areas of strategic planning and money and business management decisions. In 2012 and 2013, Matt was named to the Five Star Wealth Managers list in Detroit Hour magazine.


Five Star Award is based on advisor being credentialed as an investment advisory representative (IAR), a FINRA registered representative, a CPA or a licensed attorney, including education and professional designations, actively employed in the industry for five years, favorable regulatory and complaint history review, fulfillment of firm review based on internal firm standards, accepting new clients, one- and five-year client retention rates, non-institutional discretionary and/or non-discretionary client assets administered, number of client households served.

The 3 Missing Bull Market Killers

 Every day I get questions from clients regarding the market being high.  Yes, the market’s nominal price is at an all-time high.  But consider the following situation: Over 20 years, with an average annual gain of 9% per year, the equity market could be looking at a DOW JONES average in the 80,000 range.  Twenty years ago the Dow Jones was hovering around 3,500 and since then we have had a 12 year period when the Dow did not make a new high, but still averaged almost 9% a year.   

The three things that tend to kill a bull market are inflation, interest rates, and valuations, and none of them are present yet.

A Look at Inflation

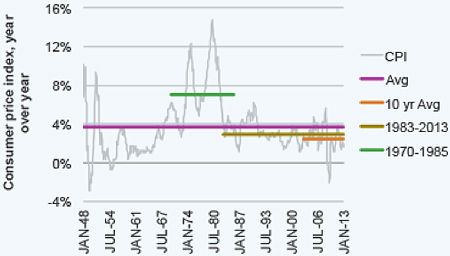
Notice that we are tracking at one of the lowest rates in history. You’ll see the Consumer price Index is well below the 10-year average. Just compare the difference between the price level of consumer goods and services in 2013 and in early 1980’s:

Sources: Bloomberg and Legg Mason. Past performance is no guarantee of future results. Please note that an investor cannot invest directly in an index, and index performance does not include transaction costs or other fees, which will affect actual investment performance.  Individual investor’s results will vary. The graph above is for illustrative purposes only and is not reflective an actual investment.

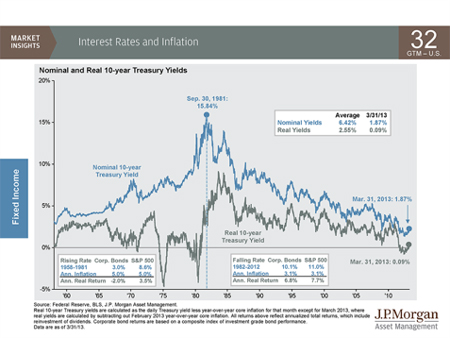
I don’t think I would be the first to remind you that interest rates are still at the lowest levels in history. This chart tracks interest rates and inflation as both trended down in recent years.

Interest Rates and Inflation

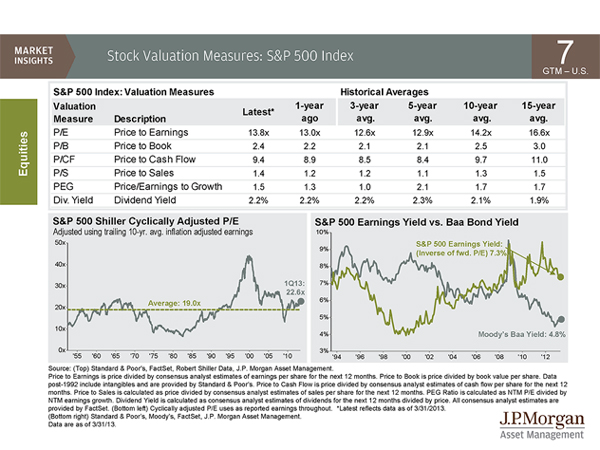
And when looking at the final potential bull killer, equity valuations, you’ll see the measures are in line with historical averages.  Not expensive and not cheap.

Equity Valuations

History as our guide would tell us that until all three or at least one of the bull market killers are present this bull is still alive and well.

Matthew E. Chope, CFP ® is a Partner and Financial Planner at Center for Financial Planning, Inc. Matt has been quoted in various investment professional newspapers and magazines. He is active in the community and his profession and helps local corporations and nonprofits in the areas of strategic planning and money and business management decisions. In 2012 and 2013, Matt was named to the Five Star Wealth Managers list in Detroit Hour magazine.


Five Star Award is based on advisor being credentialed as an investment advisory representative (IAR), a FINRA registered representative, a CPA or a licensed attorney, including education and professional designations, actively employed in the industry for five years, favorable regulatory and complaint history review, fulfillment of firm review based on internal firm standards, accepting new clients, one- and five-year client retention rates, non-institutional discretionary and/or non-discretionary client assets administered, number of client households served.

The information has been obtained from sources considered to be reliable, but we do not guarantee that the foregoing material is accurate or complete.  Any opinions are those of Center for Financial Planning, Inc., and not necessarily those of RJFS or Raymond James.  The Dow Jones Industrial Average (DJIA) is an index representing 30 stocks of companies maintained and reviewed by the editors of the Wall Street Journal.

Got Savings Bonds?

 Ahhh….savings bonds.  Throughout the years, savings bonds have been popular gifts. Grandma and grandpa have given their grandchildren savings bonds for birthdays to encourage saving for the future.  They were easily available savings vehicles that you could purchase at your local bank or, in some instances, through payroll deduction.  The paper certificates are those you might stumble across in a stack of old papers or locked away in your safety deposit box. 

What do you do if you find that you have savings bond certificates?

  • Check the dates.  All savings bonds have a maturity date; a date at which they stop accruing interest (i.e. Series EE bonds accrue interest for 30 years).  You can use any number of online savings bond calculators to find out if your bonds have matured.
  • Transition to Electronic Bonds.  The U.S. Treasury recently stopped issuing paper bonds to save costs.  If you own paper bonds that are still accruing interest, consider establishing a Treasury Direct account to convert your paper bonds to electronic bonds.  This helps eliminate the risk of loss or damage to the physical bond certificates.  If/when your bonds have matured, you can cash them in and have the proceeds deposited to your bank through Treasury Direct.
  • Check the registration on the bonds.  Savings bonds seem to be easily forgotten.  It is not uncommon for a client to find a bond in the name a deceased relative, in a former/maiden name, or in custodial registration for a child who is now a well-established adult.  Updating the registration on active savings bonds now can prevent headaches later.  Registration changes can be handled through Treasury Direct.
  • Last but not least, document that you own savings bonds.  List these holdings with your financial planner and on your Personal Record Keeping Document to ensure that these assets are not forgotten if something happens to you.

While savings bonds are not as en vogue today as they were in past decades, they can still be valuable assets.  It is worth taking the time to bring the old bonds into the current century with Treasury Direct.

Sandra Adams, CFP® is a Financial Planner at Center for Financial Planning, Inc. Sandy specializes in Elder Care Financial Planning and is a frequent speaker on related topics. In 2012 and 2013, Sandy was named to the Five Star Wealth Managers list in Detroit Hour magazine. In addition to her frequent contributions to Money Centered, she is regularly quoted in national media publications such as The Wall Street Journal, Research Magazine and Journal of Financial Planning.


Five Star Award is based on advisor being credentialed as an investment advisory representative (IAR), a FINRA registered representative, a CPA or a licensed attorney, including education and professional designations, actively employed in the industry for five years, favorable regulatory and complaint history review, fulfillment of firm review based on internal firm standards, accepting new clients, one- and five-year client retention rates, non-institutional discretionary and/or non-discretionary client assets administered, number of client households served.

The information contained in this report does not purport to be a complete description of the securities, markets, or developments referred to in this material.  Any opinions are those of Center for Financial Planning, Inc., and not necessarily those of RJFS or Raymond James.

Parents and Children Misaligned on Finances

 As the mother of a teen and a pre-teen, I can testify that parents and children often speak different languages. Like when my daughter says "I'm going to die," it doesn't generally mean she's seriously ill; it more likely means she got a hole in her favorite pants! I live for the promise of the day when my children are grown and we will be able to communicate on the same plane.  After reading the recent Intra-Family Generations Study conducted by Fidelity Investments, I’m not so sure that will ever happen…at least when it comes to finances.

The Intra Family Generations Study found that parents and their adult children are on different pages when it comes to several key family financial issues, including retirement planning, inheritance planning, and caring for elderly parents.  The study found that 97% of parents and children surveyed disagreed on whether adult children will care for their elderly parents if they need long term care assistance.  Children tend to overestimate the value of their parents’ assets (by an average of $100,000 or more) and parents are overly critical of their children’s financial decisions.  In addition, while 24% of adult children surveyed say they will need to help their parents in retirement, 97% of parents say they won’t need help.  Clearly, there are misunderstandings between the generations.

So why, you might ask, are adult children and parents so disconnected?  According to the study, (which I can vouch for in my personal experience) families simply don’t talk about financial issues.  Talking about things like investments, debts, savings shortfalls, income taxes, or estate planning is taboo in many families. 

Most interestingly, the study did find that 60% of adult children and 68% of parents indicated that they would be more comfortable discussing these important financial issues with a third party financial professional than with each other.  Financial planners are the ideal financial professionals to lead productive family meetings.

If you find yourself as either a parent who has not discussed future financial issues with your adult children or as an adult child who has not discussed long term care or financial issues with your parent, contact your financial planner to schedule your family meeting today.

Sandra Adams, CFP® is a Financial Planner at Center for Financial Planning, Inc. Sandy specializes in Elder Care Financial Planning and is a frequent speaker on related topics. In 2012 and 2013, Sandy was named to the Five Star Wealth Managers list in Detroit Hour magazine. In addition to her frequent contributions to Money Centered, she is regularly quoted in national media publications such as The Wall Street Journal, Research Magazine and Journal of Financial Planning.


Five Star Award is based on advisor being credentialed as an investment advisory representative (IAR), a FINRA registered representative, a CPA or a licensed attorney, including education and professional designations, actively employed in the industry for five years, favorable regulatory and complaint history review, fulfillment of firm review based on internal firm standards, accepting new clients, one- and five-year client retention rates, non-institutional discretionary and/or non-discretionary client assets administered, number of client households served.

Any opinions are those of Center for Financial Planning, Inc., and not necessarily those of RJFS or Raymond James.  Links are being provided for information purposes only.  Raymond James is not affiliated with and does not endorse, authorize or sponsor any of the listed websites or their respective sponsors. Raymond James is not responsible for the content of any website or the collection or use of information regarding any websites users and/or members.

The Earnings Upset

 My husband, brother-in-law and friends will never forget one Saturday afternoon spent at “The Big House”.  University of Michigan was playing Toledo and was expected to win by a large margin as they usually did against their regional MAC opponents.  I remember this particular game because they had much-coveted press box seats and sideline passes that my brother-in-law acquired in a charity auction.  They were expecting more excitement from the prestige of visiting the sidelines and sitting in the press box than from the game.  Little did they know what was in store that day.  For the first time ever Michigan lost to a MAC team with a score of 13-10!

The fourth quarter 2012 earnings season started much like the fans’ attitudes for Toledo before this game.  People were dismissing it as a lost quarter and game before it even began.  After Hurricane Sandy and the Fiscal Cliff debacle, many thought earnings would be a bust before they were even reported.  However, a little more than half way through corporate earnings releases, stocks are soaring for the year (at least as of writing this) and earnings are looking half-way decent.

  • Revenue Growth has been solid, up 3.3% so far.  Cost cutting continues to be the name of the game here.  70% of companies that have reported have beaten revenue forecasts, which are above average (66%).
  • Demand from emerging markets has fueled growth at large multinational companies.
  • A Narrowing Trade Deficit for the fourth quarter as reported by the U.S. Commerce Department means we are exporting more and importing less. This keeps more dollars in the U.S. and has also helped boost corporate earnings.

So, while positive earnings are usually the earliest released, it still should be a very decent show for corporate earnings for the end of last year.  Luckily for investors and the University of Toledo critics they now understand, “That’s why we play the game.”  As for my husband and his friends, they did enjoy the excitement of watching kick-off from the sidelines and the free snacks in the press box, if not a Michigan win!

http://www.usatoday.com/story/money/2013/02/06/corporate-profit-investors-earnings/1896885/

Angela Palacios, CFP®is the Portfolio Manager at Center for Financial Planning, Inc. Angela specializes in Investment and Macro economic research. She is a frequent contributor to Money Centered as well asinvestment updates at The Center.


Links are being provided for information purposes only.  Raymond James is not affiliated with and does not endorse, authorize or sponsor any of the listed websites or their respective sponsors.  Raymond James is not responsible for the content of any website or the collection or use of information regarding any website’s users and/or members.  The information contained in this report does not purport to be a complete description of the securities, markets or developments referred to in this material.

The information has been obtained from sources considered to be reliable, but we do not guarantee that the foregoing material is accurate or complete.  Any information is not a complete summary or statement of all available data necessary for making an investment decision and does not constitute a recommendation. Any opinions are those of the authors and not necessarily those of Raymond James.  Investing involves risk and investors may incur a profit or a loss.  Investing in emerging markets can be riskier than investing in well-established foreign markets.  The S&P 500 is an unmanaged index of 500 widely held stocks that is generally considered representative of the U.S. stock market.  Keep in mind that individuals cannot invest directly in any index and index performance does not include transaction costs or other fees, which will affect actual investment performance.  Individual investor’s results will vary.  Past performance does not guarantee future results.

Helping Clients with Asset Allocation

 In most books that discuss asset allocation, the author will mention at some point the relevance of strategic asset allocation and it being a prominent component to the investor’s outcome, which is typically measured in volatility and return.   At the Center for Financial Planning one of our core investment beliefs works with strategic asset allocation.  We believe there is an appropriate mix of assets that can help investors pursue their personal set of goals during volatile market conditions.  

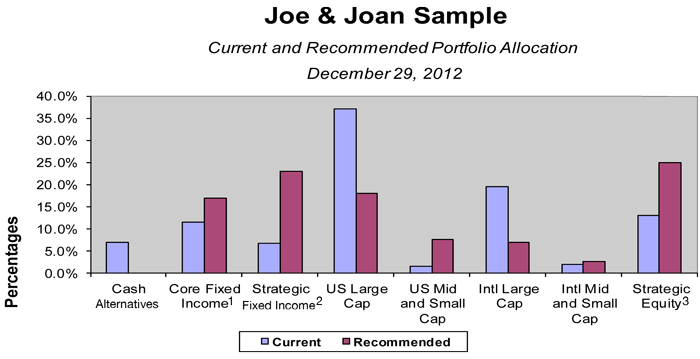
Below is a chart of a new client that recently came in for a financial plan overhaul.  You can see they had quite a difference in their current allocation to that of our recommended strategic allocation.  The current allocation in blue is overweight US Large Cap stocks and International Large Cap stocks while underweight in some of the more non-correlated assets like Strategic Income and Strategic Equity.  We were able to look over their outside investments in 401k’s, and 403b’s to help obtain what we determined to be a suitable mix, designed to keep them within their volatility comfort range as well as on track to reach their return expectations over the long haul.


These asset allocations are presented only as examples and are not intended as investment advice. Actual investor results will vary. Prior to making an investment decision, please consult with your financial advisor about your individual situation. Although derived from information which we believe to be reliable, we cannot guarantee the completeness or accuracy of the information above. Any information is not a complete summary or statement of all available data necessary for making an investment decision and does not constitute a recommendation. Investments mentioned may not be suitable for all investors. Any opinions are those of Matthew Cope and not necessarily those of RJFS or Raymond James. Investing involved risk and asset allocation does not ensure a profit or protect against a loss.
1. Core Fixed Income includes: U.S. Government bonds and high quality corporates
2. Strategic Fixed income includes: Non U.S. bonds, TIPS, less than high quality corporates and other bonds not in core fixed.
3. Strategic Equity includes: Hybrid managers, REITS, hedgeing strategies, commodities, etc.

5 Charts We are Thinking About

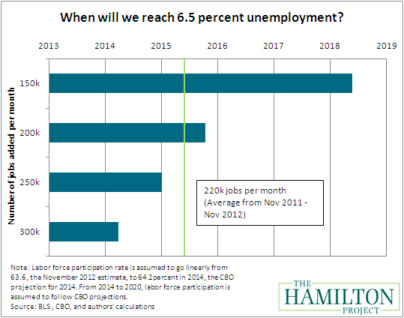
 In December the Federal Reserve (FED) announced yet another round of Quantitative Easing (QE) as Operation Twist was coming to an end. Through QE 4 the government will purchase $45 Billion in US Treasuries…every month…until unemployment comes down to 6.5%.  So we were wondering how long this could take.  The following chart lays out some scenarios.  At the current pace jobs are being added to the economy, it should take until mid-2015.

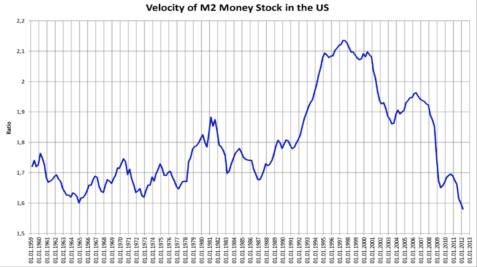
Despite all of the money the FED has been pumping into the economy the Velocity of that money has continued to slow.  Velocity means simply the rate the money is spent.  Following is a simple example of money velocity:

  • In a year I am paid $100 for going to work
  • I turn around and spend $50 to get my clothing dry-cleaned
  • Then my dry cleaner spends $30 of those dollars to buy food

The $100 in the economy was actually used to purchase $180 of goods and services over a year.  Therefore, the velocity is 1.8 ($180/$100).  Velocity of money is significant because we won’t likely see inflation in the economy until this picks up from the current record low levels over the past 50 years.

Source: Federal Reserve Bank of St. Louis

Note:  M2 Money Supply is a measure of the total money supply.  M2 includes everything in M1 and also savings and other time deposits.

Since money is not being spent with any speed, people must be saving.  Savings have increased dramatically for individuals in the U.S. as interest rates on personal savings accounts and money markets have been plummenting.  Many have moved from equities into bonds at record rates as bond rates have reached record lows.  Overall, according to the chart below, people are saving more but fewer are investing in financial markets and investing in savings accounts instead.  As you can see in the chart below the increase in percent of savings flowing into Money Markets rose from 29 to 61% over the past 4 years while the amount invested in financial markets has come down from 71 to 39% of total savings.  If investors turn a corner and start to regain faith in the financial markets, money might start flowing back that way.  This could create long-term tailwinds for stock and/or bond markets.

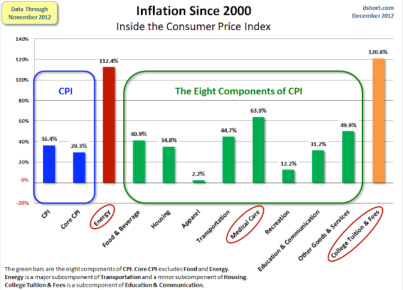
The chart below shows total Inflation over the past 12 years.  For example, College tuition and fees have gone up 120.8% in the last 12 years, if a college charge $6,000 per year in 2000 to attend now it would charge $13,250!  So if inflation is similar over the next 12 years how are we supposed to keep up with rising prices while earning less than .25% on our savings accounts meaning that same $6,000 invested at .25% over 12 years compounded annually will give us a meager $6,182?

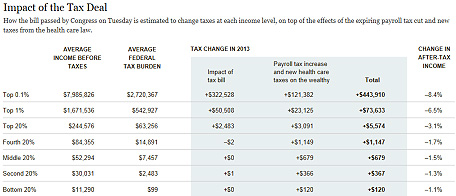
Lastly, taxes are on everyone’s mind.  On January 2nd a bill passed that will impact what everyone owes this year.  I found the table below to be a helpful summary of the impact of this bill.  For example, someone making around $85,000 per year will pay $1,147 more in taxes in 2013 than they paid in 2012.

Source: The New York Times

We use this data and more to help shape the direction our investments and financial planning recommendations for clients take over the coming years.


The information has been obtained from sources considered to be reliable, but we do not guarantee that the foregoing material is accurate or complete.  Any information is not a complete summary or statement of all available data necessary for making an investment decision and does not constitute a recommendation.  Any opinions are those of Center for Financial Planning, Inc., and not necessarily those of RJFS or Raymond James.