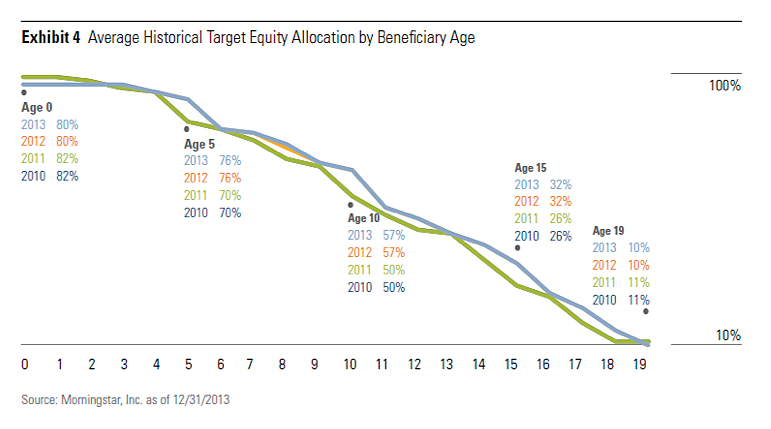
Contributed by: Center Investment Department

At Center for Financial Planning, Inc.®, one of our core investment beliefs revolves around utilizing a strategic asset allocation. We believe there is an appropriate mix of assets that can help investors meet their goals based on well-established and enduring asset classes. This can vary over time depending on your objectives and evolving markets. Finding the right combination of these asset classes and allocation to each plays a pivotal role in managing risk and aiding in ensuring stabilizing returns. In previous blog posts, we’ve discussed the purpose of asset allocation and how to determine the proper asset allocation. Now let us wrap up this subject with a hypothetical example of the implementation.
Below is a chart of a financial plan overhaul. You can see there is quite a difference between the current allocation and a recommended allocation. The current allocation (in blue) is overweight US Large Cap stocks and International Large Cap stocks while underweight the bond asset categories that we define as Core Fixed Income and Strategic Income. The financial plan takes into consideration any outside accounts like 401k’s, insurance, and/or annuity products to truly understand an entire investment portfolio and determine a suitable asset mix. This helps keep a client within their volatility comfort range as well as on track to reach their return expectations over the long haul.

Source: Morningstar
The recommendation involves selling some of the positions that fall within the overweight asset classes while adding to the underweight bond asset classes. The end result should be a portfolio with less risk which can be important leading into those early years of retirement if returns had been excellent in recent years it would be important to have a careful eye toward taxes and work with a CPA to construct a tax efficient strategy to divest some of the risk.
If you are unsure how your asset allocation stacks up, seek out a financial planner so they can assist you in developing an appropriate strategy tailored to your unique needs.
These asset allocations are presented only as examples and are not intended as investment advice. Actual investor results will vary. Prior to making an investment decision, please consult with your financial advisor about your individual situation. Although derived from information which we believe to be reliable, we cannot guarantee the completeness or accuracy of the information above. Any information is not a complete summary or statement of all available data necessary for making an investment decision and does not constitute a recommendation. Investments mentioned may not be suitable for all investors. Any opinions are those of Angela Palacios and not necessarily those of RJFS or Raymond James. Investing involves risk and asset allocation and diversification does not ensure a profit or protect against a loss. 1. Core Fixed Income includes: U.S. Government bonds and high quality corporates 2. Strategic Income includes: Non U.S. bonds, TIPS, high yield corporates and other bonds not in core fixed. 3. Strategic Equity includes: REITS, hedging strategies, commodities, managed futures etc. Large cap (sometimes "big cap") refers to a company with a market capitalization value of more than $10 billion. Large cap is a shortened version of the term "large market capitalization. Smaller mid caps, which are defined as those that fall below a certain market-cap breakpoint, and "small plus smaller mid caps", which include both companies considered small-cap and the smaller mid-cap companies. Mid caps are typically defined as companies with market caps that are between $2 billion and $10 billion. Mid-cap stocks tend to be riskier than large-cap stocks but less risky than small-cap stocks. Small caps are typically defined as companies with market caps that are less than $2 billion. Many small caps are young companies with significant growth potential. However, the risk of failure is greater with small-cap stocks than with large-cap and mid-cap stocks.