Angela Palacios

Third Quarter Investment Commentary

Investment Commentary Third Quarter Center for Financial Planning, Inc.®

As we enjoy fall, and the kids are excited for Halloween, the end of the year is right around the corner! Here is a summary of what occurred in markets over the past quarter, and what we think may come before year-end.

Executive Summary

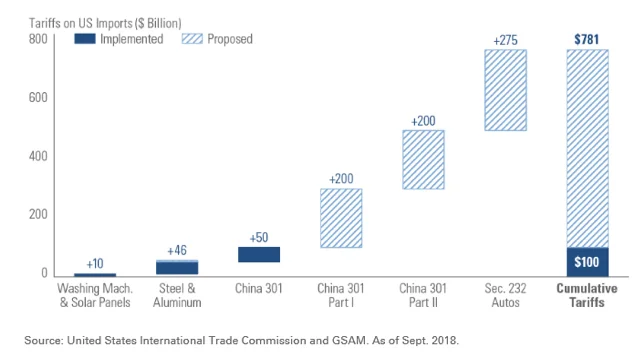
  1. It has been a strong quarter for U.S. equities, and the odds seem to be in our favor for this to continue, but a slowing economy and the trade war could, at any moment, derail growth.

  2. Bond markets have offered a haven to the increased market volatility, and they have experienced above-average returns as the Federal Reserve (the Fed) has begun lowering rates this year. As markets have marched on, we have rebalanced and increased duration within bonds to more strongly offset market volatility (this area tends to zig when the markets zag).

  3. Investors have been overly punitive to international markets.

  4. Economic indicators continue to soften.

  5. With impeachment possible, headlines will contribute to volatility, but conviction/removal of President Trump remains unlikely as this requires a two-thirds vote in the Senate.

  6. At these historically low-interest rates, federal debt is now far more affordable to service than it was 20 years ago.

  7. Remember that our portal offers a current view of your asset allocation and returns, and offers a vault to securely transfer documents to us! Also, search for us in the App Store under “Center for Financial Planning” for smartphone access to the portal.

U.S. Equity Markets

Historically, the third quarter of the year is the most difficult for the S&P 500. This is where the old saying, “Sell in May and Go Away” comes from.  Despite the increased volatility, the S&P 500 managed to make it through on a positive note, with the S&P 500 up 1.7%. For the year so far, the S&P 500 has been up a whopping 20.55%, far exceeding what most experts were calling for this year. With the markets up so much already this year, you may wonder, “Will they run out of steam?”.  A slowing economy and the trade war with China hold the potential to derail or boost returns on any given day, depending on how negotiations are going.

Interest rates

The clear winner for the quarter was bonds, as the increased volatility in U.S. equities sent investors into a more secure investment strategy, boosting the Bloomberg Barclays US Aggregate Bond Index 2.27%. So far for the year, this index is up 8.52% as the Federal Reserve has completely reversed course from tightening monetary policy (raising interest rates) to loosening monetary policy (lowering interest rates).

Interest rate activity was at the forefront of the headlines for the quarter, especially in September. During the month, eight of the top 10 developed market central banks met to discuss interest rates. The ECB (European Central Bank) and the Federal Reserve here in the U.S. were the only two to reduce target policy rates, but several others are discussing rate cuts in the months ahead. Meanwhile, here in the U.S., policymakers are projecting a third rate cut this year. We believe this will be very dependent on developments in trade talks with China, market returns, as well as the growth outlook globally and here in the U.S.

Meanwhile, a large portion of the world’s sovereign debt has negative yields making our treasury rates still very attractive to buyers overseas. This also is pressuring rates downward. As markets have continued to climb, we have been rebalancing here and increasing duration within bonds to offset market volatility more strongly (higher duration bonds tend to perform more positively than short duration bonds during a stock market retreat).

International Equities

International markets have lagged U.S. markets again during this quarter. The MSCI EAFE Index was down 1.07% while year to date is up 12.8%. So, the disparity between international and U.S. returns continued to grow during the quarter. Much of this is due to stronger economic growth in the U.S. versus overseas. Brexit, trade wars, and a strong U.S. dollar also continue to plague international returns.

Indicators

Our economic indicators continue to soften. While slightly above half are still looking positive, a few are flashing red, and positive indicators continue to become less positive or grow at a slower rate. The manufacturing index is one area teetering on the brink of contraction, giving the lowest reading in 10 years, but technically still giving a positive signal. Here are some others:

20191015a.jpg

Impeachment

The House of Representatives is once again gearing up to attempt impeachment proceedings. Impeachment is the process whereby the House of Representatives, through a simple majority vote, brings charges against a government official. After the government official is impeached, the process then moves to the Senate to try the accused. The Senate must pass its vote by a two-thirds majority. (Note: Republicans hold 53 seats, while Democrats hold 47.) If this happened, President Trump would be removed from the office, and the Vice President would take his place.

There is little in recent history to help us understand how markets would react here in the U.S. if this were to happen. Bill Clinton was impeached in 1998, and Richard Nixon resigned during his Impeachment proceedings, but was never actually impeached. Several unsuccessful attempts have been made to impeach Donald Trump, George W. Bush, and, yes, even Barack Obama. When Bill Clinton was impeached, markets were down in bear market territory (over 20% peak to trough on the S&P 500) for a short time before they rallied back. The Russian Ruble Crisis also occurred at the same time, so it is hard to say whether the impact to markets was solely due to the impeachment process.

While removal of the President seems unlikely, short-term volatility would probably occur during any period of uncertainty. This is one of the many reasons we maintain a diversified portfolio. If stocks retreat, our bond portfolios would likely perform well, and international investments may strengthen in the face of a weaker dollar. A diversified portfolio, with cash or cash equivalents set aside for short-term needs, is the most effective solution to an extremely rare event like this.

Federal Debt

We are often asked about this topic; it seems to be an ever-present concern. While attending a conference in late September, I listened to Blackstone’s Byron Wien, a 60-year veteran of the markets. He put some very long-term perspective around the Federal debt levels and interest rates. He has been hearing “we can’t pass this along to our grandchildren” for the entire 60 years he has been in the business. He won’t go so far as to say the ratio of debt to GDP doesn’t matter, but believes we must put it into perspective.

According to Byron, today, the combined debt of the U.S is $22 trillion, up almost four times from 20 years ago, when it stood at about $6 trillion. However, the blended interest rate the government pays to service this debt is only up about 25% over what the government paid 20 years ago. It now costs $430 billion annually to service debt at current interest rates. This blends out to be just a bit over 2%; whereas, 20 years ago, it cost about $360 billion to service debt at a blended interest rate of a little over 6%. In summary, it is only 25% more costly to service our debt than it was 20 years ago, even though the amount of debt has quadrupled. Wien said these low-interest rates are “an economic gift from God.”

Are you curious about how your asset allocation looks? Are you using our new client portal? Did you know this is a secure way to move documents back and forth and that our contact information is at your fingertips? If you are already using the portal and want a primer on how to navigate or a link to login, check out the new instructional video on our website’s Client Login page. If you aren’t using the login, and you are interested, please reach out so we can send you the link to activate it!

On behalf of everyone here at The Center, we hope you enjoy the end of the year and the many holidays to come!

Angela Palacios CFP®, AIF®
Partner
Director of Investments

Angela Palacios, CFP®, AIF®, is a partner and Director of Investments at Center for Financial Planning, Inc.® She chairs The Center Investment Committee and pens a quarterly Investment Commentary.


Source of return data: Morningstar Direct The information contained in this report does not purport to be a complete description of the securities, markets, or developments referred to in this material. The information has been obtained from sources considered to be reliable, but we do not guarantee that the foregoing material is accurate or complete. Any opinions are those of Angela Palacios and not necessarily those of Raymond James. Expressions of opinion are as of this date and are subject to change without notice. There is no guarantee that these statements, opinions or forecasts provided herein will prove to be correct. Investing involves risk and you may incur a profit or loss regardless of strategy selected. Keep in mind that individuals cannot invest directly in any index, and index performance does not include transaction costs or other fees, which will affect actual investment performance. Individual investor's results will vary. Past performance does not guarantee future results. Future investment performance cannot be guaranteed, investment yields will fluctuate with market conditions. The S&P 500 is an unmanaged index of 500 widely held stocks that is generally considered representative of the U.S. stock market.

Investment Commentary: Second Quarter 2019

Center for Financial Planning, Inc.® Investment Commentary 2019

Mid-Year update

As summer feels like it is finally underway after a soggy start, the markets have had anything but a soggy start to the year. The first half of 2019 ended on a strong note, as the U.S. and China seemed to resume negotiations with a constructive air. This is the best first half of the year the S&P 500 has experienced since 1997, as it posted a 18.54% gain.

Interest rates

Bonds have also enjoyed strong results this year, with the Barclays US Aggregate Bond Index up 6.11%. The Federal Reserve left rates unchanged again in June, but has made a complete about-face over the first half of the year, from projecting multiple interest rate increases to a majority of officials now thinking rates will be lower by year-end.  This comes on the heels of steady interest rate increases since 2015. The dispute over trade policy between the U.S. and China and imposition of tariffs is the main stimulus behind this thinking. This change by the Federal Reserve of wanting to reduce rates rather than raise rates (also referred to as a more dovish stance) has given a strong boost to domestic bonds as well as emerging market debt. The market has already priced in two interest rate cuts by year-end and two more in 2020. While this aggressive rate cut schedule may not fully play out (just as the three rate increases forecast for 2019 at the end of 2018 did not happen), the Federal Reserve has clearly signaled a softening economy.

Economic Snapshot

If you look at the economy and set aside the risks from the trade war, you see a pretty strong current picture; however, some of the positive signs are getting less and less positive. The expansion we have been in for so long could continue a while longer, but it seems to have less wind in its sails than it did just a year ago.

Retail Sales have come in very strong for the first half of the year, on the heels of some of the strongest readings on consumer confidence since the mid-2000s.

The Unemployment Rate, 3.6%, is at the lowest level since December 1969. The labor market remains very tight, and wages are increasing at a pace higher than inflation. This supports the high consumer confidence number and consumer spending, which is such a large part of our economy.

Inflation remains subdued with both headline and core CPI coming in at 2% or less, despite the pickup in wage inflation. Tariffs could start to increase pressure here, but we haven’t seen this flow through to the data yet.

Housing prices have been on the decline over the past year; however, the Federal Reserve’s recent change in stance on interest rates could give another slight temporary boon to this market.

Risks that could increase market volatility

Another breakdown in U.S. China trade negotiations, which could cause an abrupt pullback in markets. The tariffs in place now would start to have longer-term impact on inputs for producing goods. Businesses impacted by the tariffs would have to either cut costs elsewhere – think layoffs and discontinuing of capital expenditures – or pass the price increase along to the end consumer. Either way, this alone could start to push the economy into recession. This wildcard could have far-reaching impacts on our economy and we are closely watching developments..

The Federal Reserve not following through on cutting interest rates, as the markets are currently anticipating. The futures markets have priced in nearly four rate increases over the next 18 months. If the Fed doesn’t cut rates, we may see market rates back on the rise, meaning a short-term potential slowdown in bond returns and some headwinds for emerging market debt.

An escalation in tensions between the U.S. and Iran, which has started to affect oil prices in a negative way, although prices are still lower than they were a year ago. A sharp increase in oil prices affects consumer confidence and spending, while also putting pressure on inflation to the upside. Oil rising very quickly to high levels is often an early signal of recession

Our investment committee meets monthly and informally talks every day, if needed, regarding developments in headline risks and the economy. Sometimes, these discussions result in action, and sometimes, we take a wait-and-see approach, with an eye toward certain indicators. Right now, we continue to monitor the inversion of the yield curve, as well as the weekly initial claims for unemployment insurance from the Federal Reserve Bank of St. Louis. Both data points can be leading economic indicators that may give us some early warning signs. While we think the year should finish in positive territory, we remain cautious with our outlook for 2020.

We continue to hear great feedback on our new Client portal! We have a new instructional video to help you learn how to navigate if you are already using the portal, but also to let you know what information you could see by signing up. If you are interested, please reach out to us so we can send you the link to activate it!

On behalf of everyone here at The Center, we hope you enjoy the rest of your summer!

Angela Palacios CFP®, AIF®
Partner
Director of Investments

Angela Palacios, CFP®, AIF®, is a partner and Director of Investments at Center for Financial Planning, Inc.® She chairs The Center Investment Committee and pens a quarterly Investment Commentary.


Any opinions are those of financial advisor and not necessarily those of Raymond James. The information has been obtained from sources considered to be reliable, but we do not guarantee that the foregoing material is accurate or complete. The S&P 500 is an unmanaged index of 500 widely held stocks that is generally considered representative of the U.S. stock market. The Bloomberg Barclays US Aggregate Bond Index is a broad-based flagship benchmark that measures the investment grade, US dollar-denominated, fixed-rate taxable bond market. Indices are not available for direct investment. Any investor who attempts to mimic the performance of an index would incur fees and expenses which would reduce returns. Certified Financial Planner Board of Standards Inc. (CFP Board) owns the certification marks CFP®, CERTIFIED FINANCIAL PLANNER™, CFP® (with plaque design), and CFP® (with flame design) in the U.S., which it authorizes use of by individuals who successfully complete CFP Board's initial and ongoing certification requirements.

The Gambler

sell buy hold stocks

While I’m not a big country music fan, one of the few country songs I can sing along to is “The Gambler” by Kenny Rogers. While Kenny certainly knew how to make money, he also had a pretty good idea of how to keep it: “You gotta know when to hold ‘em, know when to fold ‘em, know when to walk away, and know when to run.” There’s a valuable lesson for investors in those lyrics. 

Most investors (and professionals, too) spend a lot of time deciding which investments to buy and little time understanding when to sell. It’s crucial to have a security selection process in place, and to understand what you own and why you own it, even if it is just an index mimicking strategy.

Part of your process, even before buying a security, should be to outline reasons you would hold the investment even through downturn periods. This can help you resist the temptation to sell in the wrong moments, for the wrong reasons. It is also important to establish factors that could cause you to sell.

At The Center, some of our reasons to potentially change strategies within a portfolio are: 

Security specific

  • Key personnel departure

  • Attainment of your price target

  • Increased correlation to other investments

  • Deviation from intended outcomes

  • Expenses

Goal specific

  • Change in circumstances (ie. entering retirement)

  • Change in risk tolerance

  • Change in the outcome needed to achieve long-term financial planning goals

Having these points in mind will make thinking about selling a position or changing your overall investment strategy (strategic allocation) easier and much less emotional. 

While it is usually best to buy and hold over longer periods of time, knowing when to hold ‘em and fold ‘em doesn’t come easily. But with some thought, you can make prudent decisions when you buy and when you sell, because you never want to have to walk away … or worse yet … have to run!

Angela Palacios, CFP®, AIF®, is a partner and Director of Investments at Center for Financial Planning, Inc.® She chairs The Center Investment Committee and pens a quarterly Investment Commentary.


Any opinions are those of Angela Palacios and not necessarily those of Raymond James. This material is being provided for information purposes only and is not a complete description, nor is it a recommendation. Investing involves risk and you may incur a profit or a loss regardless of strategy selected. Prior to making an investment decision, please consult with your financial advisor about your individual situation.

2019 First Quarter Investment Commentary

2019 First Quarter Investment Commentary

I love this time of year. In Michigan, the sun starts shining, and we slowly start to come out of our winter hibernation. It is only this time of year when wearing shorts on a sunny, 45-degree day seems completely logical.

I am always surprised by how different March can be from beginning to end; the old saying I learned in first grade, “March comes in like a lion and goes out like a lamb,” is rarely wrong. It makes me think about how the first quarter of 2019 has come in like a lion and ended like a lamb. 

Much volatility marked the end of 2018. During the last quarter of the year, markets experienced a very sharp correction, pulling back almost 20% from peak to trough for the S&P 500. Then as 2019 ramped up, markets quickly recovered, and the 2018 correction became a distant memory nearly erased from our statements, melting away like the ice from all of those winter storms.

Through the first quarter of the year, the S&P 500 rallied over 13.5%, the MSCI EAFE returned nearly 10%, and the Barclay’s Aggregate US bond index earned a respectable 2.94%.

While the downside in most cases has been nearly recovered for a diversified portfolio, some scars remain and red flags of a weakening economy are popping up (no, they aren’t the kind of flags you see on the golf course).

Yield Curve Inversion?

You may have seen headlines debating the inversion of the yield curve. This is a highly watched recession indicator. Throughout 2018, the yield curve flattened as The Federal Reserve raised interest rates. This year, the flattening has slowly morphed into a potential inversion. In the yield curve chart below, on the left, you can see that very short term rates are higher than even the 10-year treasury rate. However, longer-term rates are still higher, and the two-year yield is not yet more elevated than the 10-year yield, which is the true definition of the inversion. The chart on the right shows how the yield curve looked leading into the 2008-2009 recession. You can see that the long-term rates were no longer upward sloping, but rather flat-to-downward sloping.

 
Source: https://stockcharts.com/freecharts/yieldcurve.php

Source: https://stockcharts.com/freecharts/yieldcurve.php


The yield curve isn’t a perfect indicator, as it does from time to time give false signals that are not followed by a recession. However, the flattening and inversion of the yield curve do indicate a shaky economy that is more susceptible to outside shocks.

Many argue this is not a true inversion, and only time will tell. But this indicator does cause us to think a recession could be coming. If the inversion increases, caused most likely by long-term rates falling farther, that would increase our certainty. However, a recession generally follows an inversion by nine months to a year.

The delay happens because an inversion causes banks to tighten their lending standards. Banks make money by lending at a higher long-term rate, paying us on our short-term cash at a lower rate, and keeping the difference as profit. Paying us at a higher rate and loaning at a lower rate makes loans far less profitable. With no room for error in making a bad loan, bank standards become very strict. This alone slows the economy in many ways.

Raymond James Chief Economist Scott Brown recently cited the chart below: “In a simple model of recessions, the current spread between the 10-year Treasury note yield and the federal fund’s target rate implies about a 30% chance that the economy will enter a recession in the next 12 months. At this point, a broad-based decline in economic activity does not appear to be the most likely scenario, but the odds are too high for comfort and investors should monitor the situation closely in the months ahead.” (Source: http://beacon1.rjf.com/ResearchPDF/2019-03/a514efab-1484-4425-9c7a-9db0e0689423.pdf)

 
20190416c.jpg
 

Auto loans showing signs of concern

Auto loans, which hit us close to home in Michigan, have shown early warning signs of trouble. Despite a low unemployment rate and growth in the economy, many people still struggle to pay their bills. As of February, seven million Americans were at least three months behind in their car payments. While the government shut down may be a contributing factor, that is still a shocking statistic and one million consumers higher than in 2010, the last peak coming out of the great recession. The loans in arrears based on percentage don’t look quite as shocking, but the numbers are creeping higher.

 
20190416d.jpg
 

While these and other red flags signal an economic slowdown, we are not yet ready to confirm they signal a recession. Our investment committee is discussing areas of concern within portfolios and where we may want to make adjustments. Areas considered ripe for change include the bond positions.

We have an overweight to what we call “strategic income”, higher yielding positions that carry more credit risk than interest rate risk. While this overweight has worked for many years, we may soon reduce it back to our long-term target and add this into the Core bond portion of the portfolio. Core bonds tend to behave positively in turbulent markets and benefit from the “flight to safety” trade.

Within the core bond space, we have held shorter duration bonds which, during a rising interest rate environment, have less downside pressure as rates rise. Now that the Fed has signaled an end to raising rates for the time being, we have also looked at taking on more duration risk in that portion of the portfolio. When equity markets correct, longer duration bonds tend to perform more positively.

Headline updates:

Brexit receives an extension as Parliament in Britain seized control of the process when the Prime Minister failed, yet again, to put forth a plan lawmakers could support. This resulted in an extension until April 12; in all likelihood, another will be granted.

The Mueller investigation results have come to a close. According to Ed Mills, Raymond James Managing Direct of Washington Policy, “The conclusion of Special Counsel Robert Mueller’s investigation finding no coordination or collusion with the Trump campaign related to Russian election interference, and a Department of Justice verdict seeing no case for obstruction, offers a significant near-term political boost to President Trump, alleviating one of the big unknown DC policy risks on the market. It also has the potential to have a real impact on the President’s remaining first-term agenda, particularly on trade negotiations with China or domestic issues such as the budget or infrastructure.” (Source: http://beacon1.rjf.com/ResearchPDF/2019-03/e0fc4341-4031-486e-a5fa-bcf05d9d7c2b.pdf)

The Federal Reserve officially paused its rate-hiking cycle through 2019. The Fed also has decided to slow, and eventually stop, reducing its balance sheet by selling off the Treasuries it owns. Low rates for longer terms seems to be the theme for the near future. This affects how we will position our bond portfolios. The investment committee will this month discuss the potential of adding more duration to our core bond portfolio. This area also tends to behave positively during market pullbacks and recessions and, usually, the more duration, the better.

Trade talks with China seem to be moving in the right direction, with very slow progress. This will likely continue to hang over the markets for months to come. The next leg up of the equity markets could depend on progress here.

Negative yields around the world again, still? As of the end of February, 17% of the world’s investment-grade debt is trading with negative yields. In Europe, as of the end of March, more than 40% of government debt was trading at a negative yield – making U.S. bonds still the best kid on the block. (Source: Natixis) 

If you are interested in learning more about our process, please don’t hesitate to reach out with a phone call or email or visit the investment management page of our website. We thank you for your continued trust in us!

Angela Palacios, CFP®, AIF®
Partner
Director of Investments

Angela Palacios, CFP®, AIF®, is a partner and Director of Investments at Center for Financial Planning, Inc.® She chairs The Center Investment Committee and pens a quarterly Investment Commentary.


Any opinions are those of Angela Palacios and not necessarily those of Raymond James. The information contained in this report does not purport to be a complete description of the securities, markets, or developments referred to in this material. There is no assurance any of the trends mentioned will continue or forecasts will occur. The information has been obtained from sources considered to be reliable, but Raymond James does not guarantee that the foregoing material is accurate or complete. The case study included herein is for illustrative purposes only. Individual cases will vary. Prior to making any investment decision, you should consult with your financial advisor about your individual situation. Any information is not a complete summary or statement of all available data necessary for making an investment decision and does not constitute a recommendation.

The S&P 500 index is comprised of approximately 500 stocks and is widely seen to be representative of the U.S. market as a whole. The MSCI EAFE index is designed to measure developed market equity performance, excluding the United States & Canada. The EAFE consists of the country indices of 22 developed nations. The Bloomberg Barclays US Aggregate Bond Index is a broad-based index that measures the investment grade, US dollar-denominated, fixed-rate taxable bond market. These indexes are unmanaged and cannot be invested into directly. Past performance is no guarantee of future results.

Event in Review: 2019 Investment Outlook

With market volatility back, we came together to discuss what occurred in 2018 (particularly in the last quarter) and what we are thinking about for 2019.  If you weren’t able to attend, don’t sweat it, we have the cliff notes for you!

2019 Investment Outlook

On February 27th, 2019, Angela Palacios CFP®, AIF®, Director of Investments, CERTIFIED FINANCIAL PLANNER™, Nick Defenthaler CFP®, Senior Financial Planner, CERTIFIED FINANCIAL PLANNER ™, and Nick Boguth, Investment Research Associate teamed up to tackle these pressing questions and more.

Here is a recap of key points from the “2019 Investment Update”:

  • What spooked the markets last year:

    • Decelerating global growth lead by China

    • Declining earnings growth expectations

    • Higher short term interest rates in the U.S. and other parts of the world

    • Valuations started 2018 in elevated territory

    • UK BREXIT

    • Italian debt concerns

    • Trade issues

    • Government shutdown

    • Mueller investigation

  • What worked last year:

    • High quality fixed income rallied in this market

    • Bond duration – the more the better

    • Defensive & Low volatility stocks held up better than broad markets

    • Dividend paying stocks held up better than non-dividend paying stocks

    • Large cap equities held up better than small cap equities

    • In the last quarter of 2018 emerging and international developed markets held up better

  • Is a recession on the horizon: Recessions are mainly caused by four reasons throughout the world (Inflation, Reduction in exports, Financial Imbalance or commodity price crash). Currently inflation is benign here in the U.S., exports are healthy, financial excesses aren’t present (equity valuations and household debt are moderate), and our economy is highly driven by commodities.  So at this point it looks unlikely in the next year.

  • Yield curve: Flattened dramatically last year while the 2 and 5 year treasury bond yields did invert.  A traditional inversion is between the 2 and 10 year and is the signal usually watched for to telegraph a coming recession. We are keeping a close eye on this as this is becoming a potential concern.

  • Tax reform recap: Nick Defenthaler gave us an update on tax reform looking at the changes to income tax brackets, changes in the standard deduction and deductibility of state and local income taxes. If you’d like to hear more on this please listen in on our Year-end tax planning webinar for the details!

  • Client Portal: A Center for Financial Planning, Inc.® app??!!! We hope you are as excited as we are! Nick Boguth gave a quick demo of our new client portal and document vault. If you are interested in learning more or want to sign up for this service just reach out to your planner!

Angela Palacios, CFP®, AIF® is a partner and Director of Investments at Center for Financial Planning, Inc.® Angela specializes in Investment and Macro economic research. She is a frequent contributor The Center blog.

2018 Fourth Quarter Investment Commentary

2018 4th Quarter Investment Commentary, Volatility, Interest Rates, Shutdown Slowdown, China Trade Negotiations, Global Concerns

The 2018 wild ride!

We’d love to see you at our investment outlook event on Wednesday, February 27th from 11:30am-1pm for lunch and a full update on 2018 and the year ahead.  You can register here

How times have changed! As I write this, I often like to look back and see what I was thinking about last year at the same time.  In the fourth quarter of 2017, we were talking about how low volatility had been for an extended period and that it was unlikely to continue.  Unfortunately, we were right.  In 2017, we had only eight sessions where the S&P 500 moved up or down more than 1% (versus the average which is 53 days in a given year since 1958)!  In 2018 the number of days up or down more than 1% numbered closer to 60.  While more than average, this is closer to average volatility than we had grown accustomed to.  December is usually the least volatile month on record but this time registered more than it’s share of wild swing days for the year. 

Volatility

While we tend to love unlimited volatility on the upside, we greatly dislike downside volatility. According to behavioral finance experts Daniel Kahneman and Amos Tversky we hate the downside about twice as much as we love the upside or loss aversion.This is a concept that is embedded deeply within our investment strategy. We work to design portfolios that prevent you from making short-term decisions that contradict your long-term goals. Diversification is a key part of this process. Up until the last quarter of 2018, this was a strategy that had long been out of favor in this bull market for US Large companies. However, we started to see the benefits return. Below is a chart showing returns for 2018 broken down a few different ways and for several different benchmarks. The first section is Year-to-date (2018 full year) returns. For the year, the Barclays Aggregate was the clear winner as it was up slightly (blue bar). However, for the first three quarters of the year, it was the clear loser except for emerging markets (EM had been 2017’s, clear winner). It wasn’t until the last quarter, when volatility struck, that bonds were able to shine. The S&P 500 (US large companies) and Russell 2000 (US small companies) indexes were the exact opposite story. For the first three quarters of the year, the rally continued in a strong way with these markets up well over 10%. Once volatility struck, this meant these markets also had the farthest to fall and experienced the most downside in the last quarter of the year giving back all of their prior returns and then some for the year. It is an excellent reminder of the importance of diversification.

Source: Morningstar Direct

Source: Morningstar Direct

So what has this market so spooked?

Interest rates

The Federal Reserve raised rates for the fourth and final time of the year in December but also lowered its expectations for rates moving forward. Economic data is little changed, but The Fed’s reaction to the data shifted more dovish. The Fed is concerned that by raising too far, too fast they will invert the yield curve.  They recognize it may be necessary to slow down.   The yield curve hasn’t inverted quite yet (this is defined by the two-year being higher than the ten-year yield) but it has gotten much closer to this scenario.  This is generally a good indicator that a recession is on the horizon but has not given this signal yet.

Shutdown Showdown

Democrats took control of the House on January 3rd as the government shutdown continued.  President Trump and the Senate don’t seem to be willing to bend on their request for money for the border wall while Democrats just as strongly oppose.  Ultimately, one side will have to bend to get the government fully back up and running and neither seem to have any incentive to make this happen yet.  Markets generally aren’t rattled by government shutdowns unless they are prolonged. However, right now, everything seems to be rattling the markets.  I don’t think you can specifically point to the government shut down as being a leading market concern but it is definitely on the scorecard.  The longer it extends, the more it will erode consumer and investor confidence too.

China Trade Negotiations

Trade negotiations seem to be moving along, but this is a slow process.  U.S. based companies are starting to report reduced sales into China, so we are beginning to see a direct effect to stock prices of domestic companies.  There is talk of a hard deadline in these discussions of March 1st because if some negotiations have not come to a close by then, the U.S. will impose another round of tariffs on Chinese imports. 

Global concerns

Brexit negotiations continue to stir up markets as it is not going as well as planned.Article 50 of the Lisbon Treaty was invoked on March 29, 2017.The UK has two years from this point to leave the European Union.So the deadline is fast approaching on March 29, 2019.Here is a helpful timeline of what is to come. Brexit is sure to cause some waves in the next few months.

 
20190115b.jpg
 

To top off the global concerns, the Italians are making headlines again with debt concerns.  And just as interest rates are rising here at home, they are starting to rise overseas.  Finally yet importantly, the result of the Mueller investigations will come out soon.  This could cause a temporary shakeup in markets depending on what their findings are.

It is interesting to note that these headlines have existed for much of the year.  Up until early October, the US stock market seemed to brush them off in the wake of lower taxes.  However, lower taxes could only distract for so long until these headlines started to spill over into investor sentiment, which became clear in October.  It is important to remember to stay invested even through volatile events.  Missing the biggest up days can be devastating on your long-term returns and, true-to-form, we experienced many of those for 2018 when the markets appeared at their bleakest moments in the fourth quarter.  It is quite common that the largest up days occur during periods of downside volatility. 

We are happy to discuss your portfolio with you at any time you may feel uncomfortable with market swings.  We are monitoring your investments, making periodic changes when warranted and pro-actively rebalancing to take advantage of swings in the markets, both up and down.

We thank you for your continued trust.  Have a wonderful 2019!

Angela Palacios, CFP®, AIF®

Director of Investments

Financial Advisor, RJFS

Angela Palacios, CFP®, AIF® is the Director of Investments at Center for Financial Planning, Inc.® Angela specializes in Investment and Macro economic research. She is a frequent contributor The Center blog.


https://www.zerohedge.com/news/2018-12-04/neutoric-market-sp-has-risen-or-fallen-1-or-more-20-days-quarter https://www.bbc.com/news/uk-politics-32810887 Freedom Presentation by Nick Lacy, CFA, Chief Portfolio strategist.
The S&P 500 is an unmanaged index of 500 widely held stocks that is generally considered representative of the U.S. stock market. The Russell 2000 Index measures the performance of the 2,000 smallest companies in the Russell 3000 Index, which represent approximately 8% of the total market capitalization of the Russell 3000 Index. The MSCI EAFE (Europe, Australasia, and Far East) is a free float-adjusted market capitalization index that is designed to measure developed market equity performance, excluding the United States & Canada. The EAFE consists of the country indices of 22 developed nations.
The MSCI Emerging Markets is designed to measure equity market performance in 25 emerging market indices. The index's three largest industries are materials, energy, and banks. The Barclays US Aggregate Bond Index is a broad-based flagship benchmark that measures the investment grade, US dollar-denominated, fixed-rate taxable bond market.
Any opinions are those of Angela Palacios and not necessarily those of Raymond James. The foregoing information has been obtained from sources considered to be reliable, but we do not guarantee that it is accurate or complete. Expressions of opinion are as of this date and are subject to change without notice.
Links are being provided for information purposes only. Raymond James is not affiliated with and does not endorse, authorize or sponsor any of the listed websites or their respective sponsors. Raymond James is not responsible for the content of any website or the collection or use of information regarding any website's users and/or members.

2018 Third Quarter Investment Commentary

20181016.jpg

Diversified portfolios continue their uphill battle as the U.S. Stock market continues to be one of the few sources of positive returns this year.  In August, the current bull market became the longest on record since World War II by avoiding a 20% drawdown during that time.  Recently, the equity markets fell sharply even though the near-term prospects for the economy remain strong, but there are concerns about the November election, trade policy disruptions, FED policy and labor market constraints. Increased volatility and see-sawing markets are likely to continue in the near term.

*annualized

*annualized

Bonds have continued to be under the pressure of gradually rising interest rates.  Since December 2016, the Fed has raised short-term rates by .25% during 8 of the last 15 meetings.  The last time we experienced rising interest rates was 2004-2006.  During this period, the Fed raised short-term rates by .25% in 17 consecutive meetings in contrast!  This time, they are taking a far more measured pace trying to increase borrowing costs for businesses and consumers to keep the economy from overheating.

International and especially emerging markets are struggling the most this year due to trade war concerns and a strong U.S. dollar even though they were the darlings of 2017.

Trade War Tracking

Since the trade war is at the top of the headlines each day, I thought it would be interesting to share a scorecard.  The below chart shows the tariffs that are still only in the proposal state (diagonal lines) and tariffs that have been put into place. You can see that only a small amount had been implemented before September. On September 21st, the next $200 Billion of tariffs were put into place (China 301 Part 1).  These are tariffs on an extensive list of goods and will start at a 10% tariff, escalating to a 25% tariff in January 2019.  China retaliated by placing tariffs on another $60 Billion in U.S. goods.  This list was smaller and the amount of tariffs placed on them was lower than the market anticipated which is why we didn’t see any negative reactions from the stock market during this round.

20181016b.jpg

While we are also actively negotiating trade policies with many countries, the focus and largest amount of potential tariffs are against Chinese imports.   According to the office of the U.S. Trade Representative “The United States will impose tariffs on…Chinese imports and take other actions in response to China’s policies that coerce American companies into transferring their technology and intellectual property to domestic Chinese Enterprises.  These policies bolster China’s stated intention of seizing economic leadership in advance technology as set forth in its industrial plans, such as ‘Made in China 2025.’”

While markets are more volatile this year seeming to be swayed by the latest tariff headline daily, local markets are still boasting 10.56%  returns on the S&P500 for the year through the end of September. This says to us that markets think this trade war is survivable and possibly even beneficial to the U.S.  While tariffs are generally a negative for an economy over the long-term, investors often, only see the short-term benefits these types of strong-arm policies can bring. 

The point of free trade is that each group of producers focus on what they are best at and can produce the most efficiently (also at the lowest price/best quality).They can then sell their products and use the money to purchase what they need from the most efficient producer.This process usually stretches your dollar the farthest when it comes to purchasing power.Tariffs place an additional tax on the consumer as they usually result in higher prices for us or reduced margins for companies (or a combination of the two).We don’t share the markets rosy outlook, as we believe this trade war will result, eventually, in inflation and supply chain disruptions.It takes time to ramp up production domestically of products that become too expensive to import.When companies face the uncertainty of what retaliatory actions are coming next, they are apprehensive to make the investments required to ramp up local production in the first place. 

Unemployment

We also have to consider that the unemployment rate is back to very low levels (blue line shows below 4% unemployment) and participations rates (gray bar) remain steady.  Where are we going to get all of the new workers required to start producing items locally rather than importing? 

20181016c.jpg

We don’t think this is how Trump foresees the end game.  He hopes to force China to remove the tariffs they have historically imposed on our goods to put us on a level playing field of no tariffs, no subsidies and preventing intellectual property drain.  Whether he is right and China will be forced to come to the negotiation table remains to be seen.  Volatility should continue at slightly higher levels if this trade war continues to ramp up.

Politics

Mid-term elections are coming up, and that always puts politics at the top of everyone’s minds.  There is also fear of impeachment that we often hear from clients and how that could affect portfolios.  Impeachment is the process where the House of Representatives through a simple majority brings charges against a government official.  After the government official is impeached, the process then moves to the Senate to try the accused.  This must pass the Senate by a 2/3’s majority vote.  If this happened, President Trump would be removed from the office, and the Vice President would take his place. 

There is little to refer to in recent history to understand how markets would react here in the U.S. if this were to happen.  Bill Clinton was impeached in 1998, and Richard Nixon resigned during the Impeachment proceedings but was never actually impeached.  There have been recent unsuccessful attempts to impeach Donald Trump, George W. Bush, and, yes, even Barack Obama.  When Bill Clinton was impeached markets were down in bear market territory (over 20% peak to trough on the S&P 500) for a short time before it rallied back.  The Russian Ruble Crisis also occurred at the same time, so it is hard to say that the impact to markets was solely due to the impeachment process. So while President Trump likes to boast that the “Markets will crash and that everyone will be poor” if he were impeached that is likely not the case. 

While we don’t think this has a high likelihood of happening, if it did, short-term volatility would probably occur while there is uncertainty and this is one of the many reasons why we maintain a diversified portfolio.  If stocks retreated, it is likely that our bond portfolios would perform well and even a possibility that international investments would strengthen in the face of a weaker dollar.  We believe a diversified portfolio with short-term needs set aside in cash or cash equivalents is one of the most effective solutions to an extremely rare event like this.

While this bull market may be getting old, it is important to remember they do not simply die of old age; rather they are killed by recessions.The yield curve is getting dangerously close to inverting but has not, thus not signaling a recession…yet.We are keeping a close eye on the yield curve and trade war as these items could quickly spill us over into a risk of recession. Markets can breeze along seemingly unconcerned by these types of risk until they aren’t.When sentiment swings from optimistic to pessimistic, it can happen almost overnight.As a result, we continue to maintain that having a diversified portfolio is extremely important.We are actively taking advantage of rebalancing opportunities to make sure your portfolios are prepared.If you have any questions or would like to speak with us more on these topics, please don’t hesitate to reach out to us!

Thank you for your continued trust!

On behalf of everyone here at The Center,

Angela Palacios, CFP®, AIF®
Director of Investments
Financial Advisor, RJFS

Angela Palacios, CFP®, AIF® is the Director of Investments at Center for Financial Planning, Inc.® Angela specializes in Investment and Macro economic research. She is a frequent contributor The Center blog.


The foregoing information has been obtained from sources considered to be reliable, but we do not guarantee that it is accurate or complete, it is not a statement of all available data necessary for making an investment decision, and it does not constitute a recommendation. Any opinions are those of Angela Palacios and not necessarily those of Raymond James. Investing involves risk and you may incur a profit or loss regardless of strategy selected, including diversification and asset allocation. The S&P 500 is an unmanaged index of 500 widely held stocks that is generally considered representative of the U.S. stock market. Indices are not available for direct investment. Any investor who attempts to mimic the performance of an index would incur fees and expenses which would reduce returns.

2018 2nd Quarter Investment Commentary

20180716.jpg

Helping our clients achieve their goals is truly a team effort here at The Center.  You may not have met or spoken to the investment team here at The Center, but we are an important resource leveraged to help you achieve your goals.  Watch the video below to learn more about the investment team and how we help you reach your financial planning destination!   We are always here to help so please don’t hesitate to reach out to us! 

Rebalancing

The investment team monitors and rebalances your portfolio, in addition to portfolio construction.  It is equally important to continue to monitor portfolios and their compliance with your investing preferences and objectives as it is to determine what the proper investments are.  Rebalancing is a key part of this process.  See our recent blog post on how to rebalance a portfolio to understand the reasons and mechanics behind the process.  The most important way to be successful is to get invested and stay invested.  Rebalancing your portfolio on occasion will help you stay the course for the long-term.

Market Update

The story has stayed much the same over the past quarter with trade tensions remaining center stage.  Volatility remains, while trade war talks have spilled over into action and interest rates continue to rise.  Synchronized global growth is slowing but is not yet slow; so, do not expect growth to immediately fall off the cliff from a peak to a trough. 

U.S. markets remain in consolidation mode after a strong 2017 as investors waffle between getting comfortable with the lower rate of growth while having a strong economic and earnings outlook.  The U.S. market ended the quarter on a higher note up 3.43% for the S&P 500 despite the ups and downs throughout the quarter with China and U.S. relations.  Despite being up as much as 6.6% and down as much as 4.4% throughout the year so far we are up 2.65% through the end of the second quarter for the S&P 500. 

Bond markets have continued to struggle with bonds giving back what they are earning via interest payments, and then some, as the Bloomberg Barclays US Aggregate bond index is down 1.6% year to date.  Interest rates continue to increase at a well-telegraphed pace by the Federal Reserve with two more increases expected this year. 

In contrast to the U.S. market, international markets are struggling for the year with the MSCI EAFE posting a -2.75% so far.  In stark contrast, domestic small company stocks are enjoying a nice tailwind from the corporate tax reform so far this year.  The Russell 2000 is posting a startling 7.6% return year-to-date, all of which occurred in the second quarter.

Inflation continues its slow creep back into our economy with wages slowly starting to increase.  Just as slowing growth in the economy is not yet slow, rising inflation is not high inflation.  We are still at very low levels of inflation when you look at the history of our domestic economy.  Our investment committee has decided to add an allocation to an inflation-focused real asset strategy.  We want to add exposure within the portfolios to a strategy that would have the potential to respond more favorably than the broad equity markets to rising inflation. 

Preview of exciting changes

The investment team has been working on some exciting developments for your experience.  We will soon have a “Center for Financial Planning, Inc®” app for your smartphone where you can view returns, asset allocation and even your probability of success for your financial plan.  This new portal will be available to all who are interested.  More information and training on how to set up and view information will be coming later this year so watch your inboxes!  As always, please feel free to reach out if you ever have any questions.

On behalf of everyone here at The Center,
Angela Palacios, CFP®, AIF®
Director of Investments
Financial Advisor 

Angela Palacios, CFP®, AIF® is the Director of Investments at Center for Financial Planning, Inc.® Angela specializes in Investment and Macro economic research. She is a frequent contributor The Center blog.


The information contained in this report does not purport to be a complete description of the securities, markets, or developments referred to in this material. The information has been obtained from sources considered to be reliable, but we do not guarantee that the foregoing material is accurate or complete. Any opinions are those of Angela Palacios and not necessarily those of Raymond James. Expressions of opinion are as of this date and are subject to change without notice. There is no guarantee that these statements, opinions or forecasts provided herein will prove to be correct. Investing involves risk and no strategy can ensure success. The process of rebalancing may carry tax consequences. Raymond James and its advisors do not offer tax or legal advice. You should discuss any tax or legal matters with the appropriate professional. Diversification and strategic asset allocation do not ensure a profit or protect against a loss. The S&P 500 is an unmanaged index of 500 widely held stocks. The Bloomberg Barclays US Aggregate Bond Index is a market capitalization-weighted index, meaning the securities in the index are weighted according to the market size of each bond type. Most U.S. traded investment grade bonds are represented. Municipal bonds, and Treasury Inflation-Protected Securities are excluded, due to tax treatment issues. The index includes Treasury securities, Government agency bonds, Mortgage-backed bonds, Corporate bonds, and a small amount of foreign bonds traded in U.S. The MSCI EAFE (Europe, Australia, Far East) index is an unmanaged index that is generally considered representative of the international stock market. These international securities involve additional risks such as currency fluctuations, differing financial accounting standards, and possible political and economic instability. The Russell 2000 index is an unmanaged index of small cap securities which generally involve greater risks. Inclusion of these indexes is for illustrative purposes only. Keep in mind that individuals cannot invest directly in any index, and index performance does not include transaction costs or other fees, which will affect actual investment performance. Individual investor's results will vary. Past performance does not guarantee future results. Bond prices and yields are subject to change based upon market conditions and availability. If bonds are sold prior to maturity, you may receive more or less than your initial investment. Holding bonds to term allows redemption at par value. There is an inverse relationship between interest rate movements and bond prices. Generally, when interest rates rise, bond prices fall and when interest rates fall, bond prices generally rise.

Taking Security Seriously

20180712.jpg

Ever wonder what steps we take to ensure the security of your information?

This is a topic we take very seriously here at The Center. There are a variety of ways we work to ensure the privacy of your data. One of the steps we took was to hire our IT Manager, James Brown. James brought with him not only an in-depth knowledge of networks, hardware, and software but also an eye for security best practices. A core value of our firm is to seek continuous learning. While we have a large number of individuals on staff who seek new certifications on the topics of investment management and financial planning, it is also just as important in the world of technology and security. While James possessed a large amount of knowledge on the topic of security, he felt it is important to remain on top of the latest threats. This is why he sought to obtain the CompTIA Security+ certification.

In “non-geek speak” CompTIA Security+ certification is an assessment of an IT professional’s cybersecurity skills in risk management, disaster recovery and computer security best practices.

CompTIA Security+ is a vendor-independent global cybersecurity certification for IT Security professionals. Security+ certified professionals have proven competency in:

  • Network security

  • Threats and vulnerabilities

  • Compliance and operational security

  • Cryptography

  • Access control/identity management

  • Application, data and host security

This is not an easy test to pass, let alone on your first try! So join us in congratulating
James on achieving this! We know he spent countless hours for the benefit of you, our
client, studying to pass.

In addition to James, we also have an excellent resource available to us in security through
our relationship with Raymond James. James requested that Raymond James perform a
scan of our externally facing addresses and ports. This is a vulnerability assessment that
checks for a variety of ways a hacker could make their way into our system and gain access
to your data. After their threat assessment, we were found to have no vulnerabilities, a
clean bill of health so to speak.

James will be sharing some of what he has learned in his upcoming webinar on “Staying
Safe with Computer Best Practices

Angela Palacios, CFP®, AIF® is the Director of Investments at Center for Financial Planning, Inc.® Angela specializes in Investment and Macro economic research. She is a frequent contributor The Center blog.

2018 1st Quarter Investment Commentary

20180412.jpg

Trade wars and tariffs have dominated the headlines over the past quarter. Volatility has increased for equity markets around the world because there are fears stemming from the possibility of a trade war.  To learn more about tariffs and what we think about how this could impact the markets click here.

The Federal Reserve (FED) raised rates as anticipated in March.  This is the first rate hike of the year.  There are two more rate hikes widely expected to come this year.  Gross Domestic Product (GDP) growth has been slightly ahead of what has been expected; so, this could hint at a faster rate hike path than anticipated.  Economists were expecting growth to come in at 2.7% for the 4th quarter and it came in at a revised 2.9%.  Good news for the economy as we are growing faster and seem to be on solid footing.  However, if the market thinks that the FED will start to raise rates faster in response to increased growth, this could negatively impact bond prices as their yields increase.  Both consumer spending and business investment have been strong.  Payroll taxes went down in February with the new tax reform which means we may have more money in our pockets, meaning we have the capacity, now, to spend even more.

The story is even better overseas as GDP growth has gone from mixed throughout the world (disappointing in most countries outside of the U.S. up until recently) to synchronized expansion.

Breaking a streak

The Dow Jones Industrials Average and the S&P 500 snapped an impressive nine-quarter streak of gains.  This has been the longest stretch of quarterly gains for the Dow for over two decades.  Prior long streaks were broken in 1997 (an 11 quarter rally for the Dow).  The S&P had a more recent impressive streak that also lasted nine quarters and was broken the first quarter of 2015.  Other markets including bonds and international were also down this quarter.  See the chart below for more details

20180412_chart.jpg

The cash quandary

Have you noticed your money market or bank deposits rates spiking along with all of these rate hikes from the Federal Reserve?  If not, you aren’t alone.  Rates have continued to remain frustratingly low on our most liquid savings accounts.  While the FED has raised rates by .25% on six separate occasions since 2015, deposit rates have not moved much.  There are two likely reasons for this:

  1. While the FED has raised short-term rates, long-term rates have not reacted as much. Since banks make money on the difference between the interest they charge on loans (which tend to be longer, think mortgages) and what they pay out in interest to their depositors, rates have stayed low for depositors. Banks have been unable to increase the rates they charge to loan individuals money and, therefore, they cannot raise the rates they pay on savings accounts.

  2. Deposits at banks in small savings accounts are at an all-time high. This money tends to be steady even if the interest rate paid at the bank down the street is higher. So banks don’t have to raise the rates they pay to keep the assets. It is too much of a bother to close your account, withdraw the money, open a new account and deposit the money for a .1% boost in the interest rate.

Technology volatility

Technology stocks are catching headlines recently as Facebook had a breach of privacy and Apple and Alphabet suffer from fears of tightening regulation.  The recent darlings of the stock market suffer because investors are calling in to question all of these technology companies that gather our personal data to enhance our user experience.

Midterm Elections

While it is still early in the year, midterm elections are starting to heat up.  Democrats are out of power, and the midterm elections tend to favor the party that is out of power.  Currently, we have a strong economy, and that is a factor that can influence whether voters go out to the polls and for whom they vote. A stable economy tends to encourage the status quo vote. The increased stock market volatility could favor the party that is out of power, though.  While I’m not here to debate who will and won’t win, I am interested in how(or if) that could affect your portfolios.  Generally, it isn’t a good idea to make changes within a portfolio based on politics.  Politics are emotional, and it is rarely a good idea to mix these sensitive emotions with our investment dollars.  We generally recommend not to make any major changes to a portfolio driven solely by an upcoming election. 

In times of market distress including the areas outlined above that cause temporary volatility in markets, investors need to focus on the basics:

  • sticking to a diversified portfolio

  • maintaining appropriate cash reserves

  • rebalancing

If you ever have any questions on these or other topics don’t hesitate to reach out to us!

On behalf of everyone here at The Center,

Angela Palacios, CFP®, AIF®
Director of Investments
Financial Advisor

Angela Palacios, CFP®, AIF® is the Director of Investments at Center for Financial Planning, Inc.® Angela specializes in Investment and Macro economic research. She is a frequent contributor The Center blog.


https://finance.yahoo.com/news/dow-streak-quarterly-gains-risk-184351660.html https://am.jpmorgan.com/us/en/asset-management/gim/protected/adv/insights/should-i-hold-cash The information contained in this commentary does not purport to be a complete description of the securities, markets, or developments referred to in this material. The information has been obtained from sources considered to be reliable, but we do not guarantee that the foregoing material is accurate or complete. Any opinions are those of the professionals at The Center and not necessarily those of Raymond James. Expressions of opinion are as of this date and are subject to change without notice. There is no guarantee that these statements, opinions or forecasts provided herein will prove to be correct. This material is being provided for information purposes only. Any information is not a complete summary or statement of all available data necessary for making an investment decision and does not constitute a recommendation. Please note, changes in tax laws may occur at any time and could have a substantial impact upon each person's situation. While we are familiar with the tax provisions of the issues presented herein, as Financial Advisors of RJFS, we are not qualified to render advice on tax or legal matters. You should discuss tax or legal matters with the appropriate professional. Investments mentioned may not be suitable for all investors. Future investment performance cannot be guaranteed, investment yields will fluctuate with market conditions. Investing involves risk and you may incur a profit or loss regardless of strategy selected. The S&P 500 is an unmanaged index of 500 widely held stocks that is generally considered representative of the U.S. stock market. Keep in mind that individuals cannot invest directly in any index, and index performance does not include transaction costs or other fees, which will affect actual investment performance. Individual investor's results will vary. Past performance does not guarantee future results. Prior to making an investment decision, please consult with your financial advisor about your individual situation. The companies engaged in the communications and technology industries are subject to fierce competition and their products and services may be subject to rapid obsolescence. The MSCI EAFE (Europe, Australasia, and Far East) is a free float-adjusted market capitalization index that is designed to measure developed market equity performance, excluding the United States & Canada. The EAFE consists of the country indices of 22 developed nations. The Dow Jones Industrial Average (DJIA), commonly known as “The Dow” is an index representing 30 stock of companies maintained and reviewed by the editors of the Wall Street Journal. The Russell 2000 Index measures the performance of the 2,000 smallest companies in the Russell 3000 Index, which represent approximately 8% of the total market capitalization of the Russell 3000 Index. The Barclays US Aggregate Bond Index is a broad-based flagship benchmark that measures the investment grade, US dollar-denominated, fixed-rate taxable bond market. The Bloomberg Barclays U.S. Corporate High Yield Bond Index is composed of fixed-rate, publicly issued, non-investment grade debt, is unmanaged, with dividends reinvested, and is not available for purchase. The index includes both corporate and non-corporate sectors. The corporate sectors are Industrial, Utility and Finance, which include both U.S. and non-U.S. corporations. The IA SBBI US IT Government Bond Index is an index created by Ibbotson Associates designed to track the total return of intermediate maturity US Treasury debt securities. Links are being provided for information purposes only. Raymond James is not affiliated with and does not endorse, authorize or sponsor any of the listed websites or their respective sponsors. Raymond James is not responsible for the content of any website or the collection or use of information regarding any website's users and/or members.