Investment Planning

Third Quarter Investment Commentary

Investment Commentary Third Quarter Center for Financial Planning, Inc.®

As we enjoy fall, and the kids are excited for Halloween, the end of the year is right around the corner! Here is a summary of what occurred in markets over the past quarter, and what we think may come before year-end.

Executive Summary

  1. It has been a strong quarter for U.S. equities, and the odds seem to be in our favor for this to continue, but a slowing economy and the trade war could, at any moment, derail growth.

  2. Bond markets have offered a haven to the increased market volatility, and they have experienced above-average returns as the Federal Reserve (the Fed) has begun lowering rates this year. As markets have marched on, we have rebalanced and increased duration within bonds to more strongly offset market volatility (this area tends to zig when the markets zag).

  3. Investors have been overly punitive to international markets.

  4. Economic indicators continue to soften.

  5. With impeachment possible, headlines will contribute to volatility, but conviction/removal of President Trump remains unlikely as this requires a two-thirds vote in the Senate.

  6. At these historically low-interest rates, federal debt is now far more affordable to service than it was 20 years ago.

  7. Remember that our portal offers a current view of your asset allocation and returns, and offers a vault to securely transfer documents to us! Also, search for us in the App Store under “Center for Financial Planning” for smartphone access to the portal.

U.S. Equity Markets

Historically, the third quarter of the year is the most difficult for the S&P 500. This is where the old saying, “Sell in May and Go Away” comes from.  Despite the increased volatility, the S&P 500 managed to make it through on a positive note, with the S&P 500 up 1.7%. For the year so far, the S&P 500 has been up a whopping 20.55%, far exceeding what most experts were calling for this year. With the markets up so much already this year, you may wonder, “Will they run out of steam?”.  A slowing economy and the trade war with China hold the potential to derail or boost returns on any given day, depending on how negotiations are going.

Interest rates

The clear winner for the quarter was bonds, as the increased volatility in U.S. equities sent investors into a more secure investment strategy, boosting the Bloomberg Barclays US Aggregate Bond Index 2.27%. So far for the year, this index is up 8.52% as the Federal Reserve has completely reversed course from tightening monetary policy (raising interest rates) to loosening monetary policy (lowering interest rates).

Interest rate activity was at the forefront of the headlines for the quarter, especially in September. During the month, eight of the top 10 developed market central banks met to discuss interest rates. The ECB (European Central Bank) and the Federal Reserve here in the U.S. were the only two to reduce target policy rates, but several others are discussing rate cuts in the months ahead. Meanwhile, here in the U.S., policymakers are projecting a third rate cut this year. We believe this will be very dependent on developments in trade talks with China, market returns, as well as the growth outlook globally and here in the U.S.

Meanwhile, a large portion of the world’s sovereign debt has negative yields making our treasury rates still very attractive to buyers overseas. This also is pressuring rates downward. As markets have continued to climb, we have been rebalancing here and increasing duration within bonds to offset market volatility more strongly (higher duration bonds tend to perform more positively than short duration bonds during a stock market retreat).

International Equities

International markets have lagged U.S. markets again during this quarter. The MSCI EAFE Index was down 1.07% while year to date is up 12.8%. So, the disparity between international and U.S. returns continued to grow during the quarter. Much of this is due to stronger economic growth in the U.S. versus overseas. Brexit, trade wars, and a strong U.S. dollar also continue to plague international returns.

Indicators

Our economic indicators continue to soften. While slightly above half are still looking positive, a few are flashing red, and positive indicators continue to become less positive or grow at a slower rate. The manufacturing index is one area teetering on the brink of contraction, giving the lowest reading in 10 years, but technically still giving a positive signal. Here are some others:

20191015a.jpg

Impeachment

The House of Representatives is once again gearing up to attempt impeachment proceedings. Impeachment is the process whereby the House of Representatives, through a simple majority vote, brings charges against a government official. After the government official is impeached, the process then moves to the Senate to try the accused. The Senate must pass its vote by a two-thirds majority. (Note: Republicans hold 53 seats, while Democrats hold 47.) If this happened, President Trump would be removed from the office, and the Vice President would take his place.

There is little in recent history to help us understand how markets would react here in the U.S. if this were to happen. Bill Clinton was impeached in 1998, and Richard Nixon resigned during his Impeachment proceedings, but was never actually impeached. Several unsuccessful attempts have been made to impeach Donald Trump, George W. Bush, and, yes, even Barack Obama. When Bill Clinton was impeached, markets were down in bear market territory (over 20% peak to trough on the S&P 500) for a short time before they rallied back. The Russian Ruble Crisis also occurred at the same time, so it is hard to say whether the impact to markets was solely due to the impeachment process.

While removal of the President seems unlikely, short-term volatility would probably occur during any period of uncertainty. This is one of the many reasons we maintain a diversified portfolio. If stocks retreat, our bond portfolios would likely perform well, and international investments may strengthen in the face of a weaker dollar. A diversified portfolio, with cash or cash equivalents set aside for short-term needs, is the most effective solution to an extremely rare event like this.

Federal Debt

We are often asked about this topic; it seems to be an ever-present concern. While attending a conference in late September, I listened to Blackstone’s Byron Wien, a 60-year veteran of the markets. He put some very long-term perspective around the Federal debt levels and interest rates. He has been hearing “we can’t pass this along to our grandchildren” for the entire 60 years he has been in the business. He won’t go so far as to say the ratio of debt to GDP doesn’t matter, but believes we must put it into perspective.

According to Byron, today, the combined debt of the U.S is $22 trillion, up almost four times from 20 years ago, when it stood at about $6 trillion. However, the blended interest rate the government pays to service this debt is only up about 25% over what the government paid 20 years ago. It now costs $430 billion annually to service debt at current interest rates. This blends out to be just a bit over 2%; whereas, 20 years ago, it cost about $360 billion to service debt at a blended interest rate of a little over 6%. In summary, it is only 25% more costly to service our debt than it was 20 years ago, even though the amount of debt has quadrupled. Wien said these low-interest rates are “an economic gift from God.”

Are you curious about how your asset allocation looks? Are you using our new client portal? Did you know this is a secure way to move documents back and forth and that our contact information is at your fingertips? If you are already using the portal and want a primer on how to navigate or a link to login, check out the new instructional video on our website’s Client Login page. If you aren’t using the login, and you are interested, please reach out so we can send you the link to activate it!

On behalf of everyone here at The Center, we hope you enjoy the end of the year and the many holidays to come!

Angela Palacios CFP®, AIF®
Partner
Director of Investments

Angela Palacios, CFP®, AIF®, is a partner and Director of Investments at Center for Financial Planning, Inc.® She chairs The Center Investment Committee and pens a quarterly Investment Commentary.


Source of return data: Morningstar Direct The information contained in this report does not purport to be a complete description of the securities, markets, or developments referred to in this material. The information has been obtained from sources considered to be reliable, but we do not guarantee that the foregoing material is accurate or complete. Any opinions are those of Angela Palacios and not necessarily those of Raymond James. Expressions of opinion are as of this date and are subject to change without notice. There is no guarantee that these statements, opinions or forecasts provided herein will prove to be correct. Investing involves risk and you may incur a profit or loss regardless of strategy selected. Keep in mind that individuals cannot invest directly in any index, and index performance does not include transaction costs or other fees, which will affect actual investment performance. Individual investor's results will vary. Past performance does not guarantee future results. Future investment performance cannot be guaranteed, investment yields will fluctuate with market conditions. The S&P 500 is an unmanaged index of 500 widely held stocks that is generally considered representative of the U.S. stock market.

Even the Best Investors Lose Money

Nicholas Boguth Contributed by: Nicholas Boguth

Even the Best Investors Lose Money

In an ideal financial planning universe, we would only invest in things that go up. We would never see our account values go down. We would never even see a negative number on our statements. Bonds would pay interest, and interest rates would be so stable that bond prices didn’t move. Stocks would pay dividends, and every company’s earnings would only grow.

Unfortunately for us, investing is not that simple. There is no growth without risk. Nothing, and I mean NOTHING, is guaranteed to appreciate. Even the world’s best investors lose money from time to time, but what makes them the best investors is how they react when those losses happen.

Let’s take a look at Warren Buffett, one of the most successful investors of all time, and how his stock has done compared to the S&P 500 (a collection of the 500 largest public U.S. companies) over the past 25 years. Is it all positive? Does he beat the S&P 500 every year? If he did lose to the S&P 500, was it close? Would you stick with him for the following year?

Data: Morningstar Direct. Total Return.

Data: Morningstar Direct. Total Return.

What stands out to you? Two things jumped out at me:

  1. Both were negative five out of the past 25 years.
    Even one of the best investors in the world lost money the SAME number of times as the S&P 500.

  2. Buffett returned less than the S&P 500 nine times, and one of those times was by more than 40%!
    If you looked at your statement and saw that your $10,000 turned into $8,000, while everyone who owned just the 500 biggest U.S. companies now had $12,000, would you stick with Buffett or would you switch investments?

Investing is hard because of risk. Investments depreciate or underperform for years at a time. You can’t avoid this fact. One thing you can avoid is making decisions that ultimately may be harmful to your goals, by having a plan in place for those years when investments aren’t going the way you’d like.

Don’t have a plan? We would be glad to help.

Nicholas Boguth is an Investment Research Associate at Center for Financial Planning, Inc.® He performs investment research and assists with the management of client portfolios.


Any opinions are those of Nicholas Boguth and not necessarily those of Raymond James. This material is being provided for illustration purposes only and is not a complete description, nor is it a recommendation of any investment mentioned. There is no guarantee that these statements, opinions or forecasts provided herein will prove to be correct. Investing involves risk and you may incur a profit or a loss regardless of strategy selected. Prior to making an investment decision, please consult with your financial advisor about your individual situation. The S&P 500 index is comprised of approximately 500 widely held stocks that is generally considered representative of the U.S. stock market. It is unmanaged and cannot be invested into directly. Past performance is no guarantee of future results.

Climate Change and What It Means for Investors

Jaclyn Jackson Contributed by: Jaclyn Jackson

Climate Change and What it Means for Investors

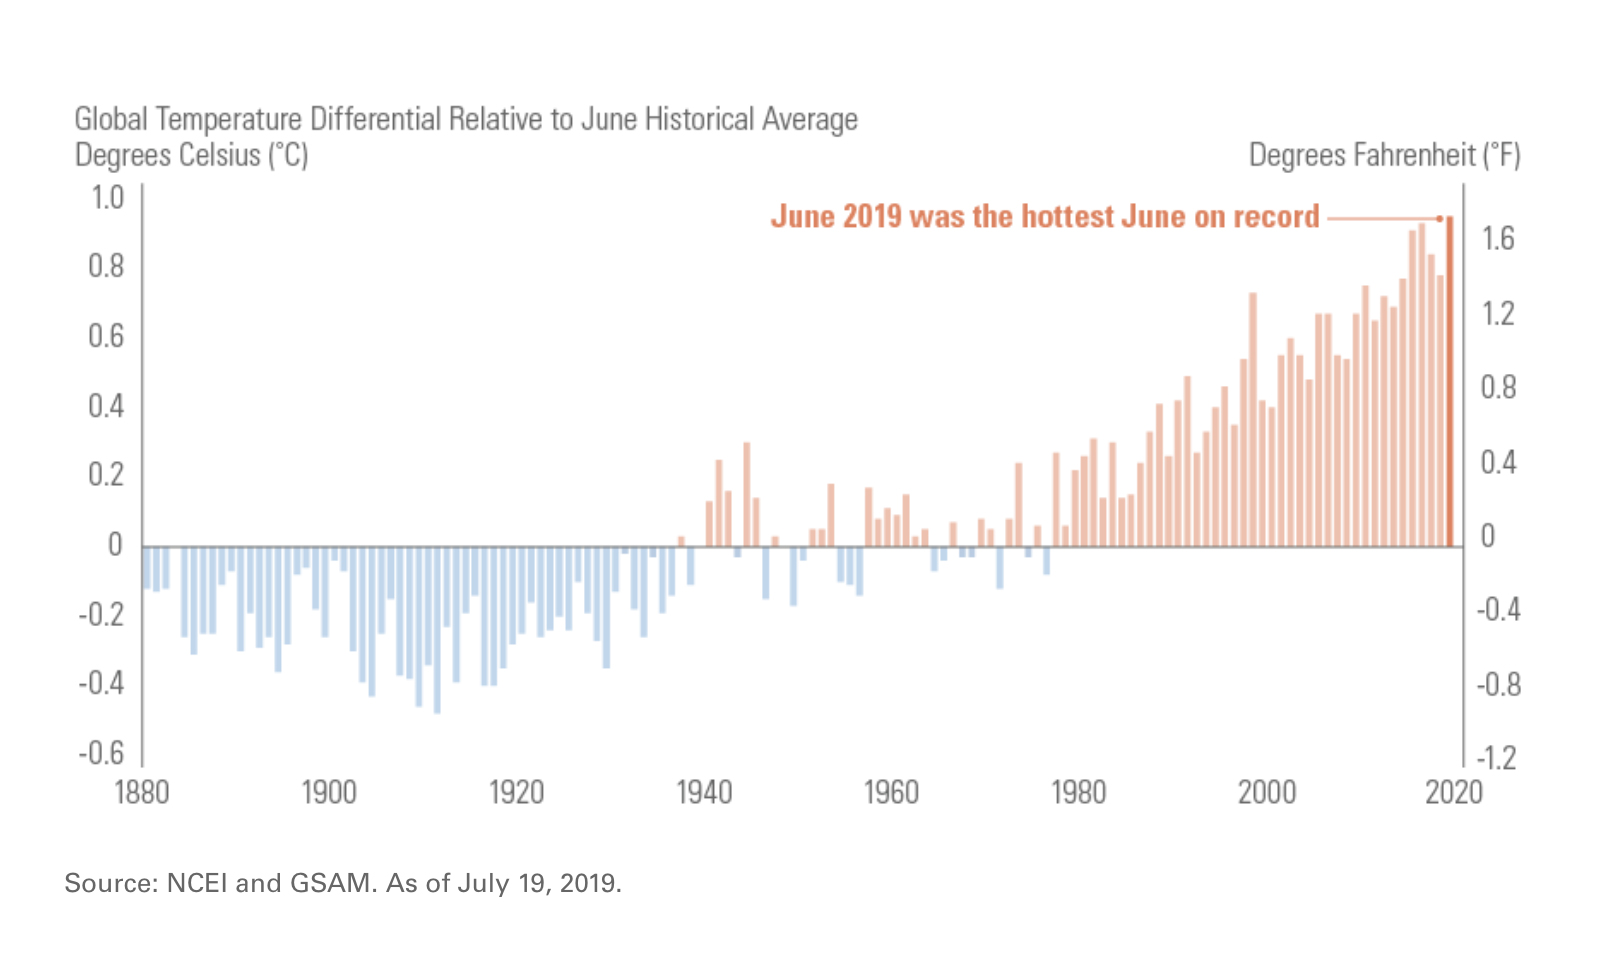
Coming in 1.71°F above its historical average of 59.9°F, June 2019 was the hottest June globally in 140 years of recorded data. June’s temperature increase is the latest in an upward trend that began in the 1970s. While debates hotter than any June persist about the validity of global warming, the fact remains that climate change carries significant implications for individuals, industries, and investors alike.

Global Temperature Differential Relative to June Historical Average

Industry and Economic Impact

Not convinced Mother Nature can wreak havoc on your day-to-day life? Just ask any New Yorker who recently experienced a heatwave, flooding, and power outages all in the same week. In fact, there’s no need to look that far; as of this writing, some Detroiters are still hoping to regain power after incredibly warm weather hit the region.

While it’s pretty clear how extreme weather conditions generate problems for energy companies, heatwaves can disrupt other industries. Manufacturing plants experience reduced production when temperatures soar above 90 degrees; fewer people look for homes, which affects the real estate industry’s most active season; and increased hospitalizations impact insurance companies. While these problems more directly speak to developed, urban areas and industries, they don’t even begin to define the potential implications of climate change around the globe.

Goldman Sachs summarized it best: “We believe that in addition to environmental impact, direct damage from mortality, labor productivity, agriculture, energy demand, and coastal storms may also significantly impact overall economic growth.”

Investors Demand More

It’s no wonder 477 global investors (including money managers and large pension funds around the world) issued a letter to governments attending the G-20 summit in Osaka, Japan. Commanding $34 trillion in assets, they’ve concluded that ignoring the Paris Agreement’s mission would create “an unacceptably high temperature increase that would cause substantial negative economic impacts.” Investors created the letter to petition government leaders to achieve the 2015 Paris Agreement goals, accelerate private sector investment into low carbon transition, and commit to improved climate-related financial reporting.

Be the Change

These investors also use their substantial financial weight to speak with companies in their portfolios about how they are addressing and alleviating industry-specific climate change issues. Individual investors can take a similar approach, by using their financial power to invest in mutual/exchange traded funds that evaluate the environmental, social, and governance (ESG) qualities of companies in their portfolios, as well as more traditional methods of research.

Are you ready to be the change?

Learn more about The Center’s Social Portfolio and ESG investing here.

Jaclyn Jackson is a Portfolio Administrator at Center for Financial Planning, Inc.® She manages client portfolios and performs investment research.


Investors should carefully consider the investment objectives, risks, charges and expenses of Mutual Funds and Exchange-Traded Funds (ETFs) before investing. The prospectus and summary prospectus contains this and other information about Mutual Funds and ETFs. The prospectus and summary prospectus is available from your financial advisor and should be read carefully before investing.

Opinions expressed are those of the author and are not necessarily those of Raymond James. All opinions are as of this date and are subject to change without notice. The information contained in this blog does not purport to be a complete description of the securities, markets, or developments referred to in this material. The information has been obtained from sources considered to be reliable, but we do not guarantee that the foregoing material is accurate or complete. Investing involves risk and investors may incur a profit or a loss regardless of strategy selected. Prior to making an investment decision, please consult with your financial advisor about your individual situation.

SOURCES: https://www.pionline.com/esg/investor-group-pleads-g-20-global-warming https://theinvestoragenda.org/wp-content/uploads/2019/06/FINAL-at-June-24-Global-Investor-Statement-to-Governments-on-Climate-Change-26.06.19-1.pdf

Women’s Leadership as an Investment Concept

Center for Financial Planning, Inc.® Women's Leadership

REPOST

Did you know three of the five partners at The Center are women? We live the value of gender diversity in the ownership and leadership of our firm.

Women’s leadership can and should also be understood as an investment concept.

Many studies have shown that women bring a unique perspective to senior and executive management roles within firms. This “secret ingredient” adds profitability, better risk preparedness, more collaboration, and more innovation to companies. 

An emerging consensus recognizes that the status and roles of women may be an excellent clue to a company’s growth potential.

Despite this, a large wage gap persists between women and equivalent men in the workforce, and there’s very little gender diversity among senior management and corporate boards.

Many barriers affect female participation in management and the boardroom.

One of the most easily understood is time out of the workforce.

Women spend an average 12.6 years out of the workforce to care for children or parents, whereas men only spend an average of 10 months outside the workforce!

This pull between work and family responsibilities likely has a lot to do with the disparities that still exist. After reading Lean In by Sheryl Sandberg, COO of Facebook, I discovered that barriers within ourselves also prevent women from climbing the corporate ladder. There are days when I long to be able to spend more time at home with my daughter, but I also recognize the importance of being the role model of a woman who is happy and successful in her career, as well as enjoying quality family time. My daughter also gains the benefit of seeing a father who is very engaged and shares the responsibilities of parenting, who is a real partner to me. This rhythm works for us. Finding your family’s own rhythm and peace is of utmost importance.

Sharing ideas and our own experiences is part of the solution. Another potential solution is using your investments to express your viewpoint with your dollars. If you would like to learn more, please contact your financial planner!

Angela Palacios, CFP®, AIF®, is a partner and Director of Investments at Center for Financial Planning, Inc.® She chairs The Center Investment Committee and pens a quarterly Investment Commentary.


Any opinions are those of Angela Palacios, CFP®, AIF® and not necessarily those of Raymond James. Expressions of opinion are as of this date and are subject to change without notice. The information has been obtained from sources considered to be reliable, but Raymond James does not guarantee that the foregoing material is accurate or complete. Raymond James is not affiliated with and does not endorse the opinions or services of Sheryl Sandberg or Facebook. This material is being provided for information purposes only and is not a complete description, nor is it a recommendation. This information is not intended as a solicitation or an offer to buy or sell any security referred to herein. Past performance is not a guarantee of future results. Investing involves risk and investors may incur a profit or a loss regardless of strategy selected. Certified Financial Planner Board of Standards Inc. owns the certification marks CFP®, CERTIFIED FINANCIAL PLANNER™, CFP® (with plaque design) and CFP® (with flame design) in the U.S., which it awards to individuals who successfully complete CFP Board's initial and ongoing certification requirements.

Women & Investing: How to Better Engage With Your Finances

Laurie Renchik Contributed by: Laurie Renchik, CFP®, MBA

Center for Financial Planning, Inc.® Women and Investing

REPOST

Working with women over the last 20 years has taught me that we can’t help our families, our communities, or the world if we don’t understand how money works. I have seen firsthand that when women are engaged in financial decisions, as both professionals and as consumers, we can tip the scales and improve all women’s ability to lead and understand the influence of money on financial independence.

If you are a busy, multi-tasking woman, the first step is usually the most difficult. Once you decide to pull a financial plan together, the pieces start to fall nicely into place. Having trouble with those first steps?

Practical advice to get you started:

  • Give your personal financial life the attention it needs. If you feel like life is whizzing by, take time to step back and ask, “Am I on the right track?”. Implementing a financial plan serves as a point of reference for staying on track.

  • If your goals change along the way, make timely adjustments. You probably have at least a vague picture in your head of what you want in the future. The beauty of the financial planning process is that it makes conversations happen, especially with the help of a financial planner who can serve as a thinking partner.

  • Pull a team together. Your financial planner, tax preparer, and attorney can help you keep your arms around the different aspects of your financial plan. They’ll also recommend course corrections when necessary and chart the progress as you go.

Practical advice to keep you on track:

  • Continue to ask questions. Financial planning means asking, “Where do I want to be in 3 years?, 10 years?, 20 years?”. This may change as you go along.

  • Stick to your plan. Good financial habits are a foundation upon which you can build for a lifetime.

  • Stay focused on your priorities. A good plan will help you remember what is most important in your life and decide how your financial resources can help you get there.

The future is not the finish line; it is just the beginning, if you have the resources to lead the life you want. Is there a better reason to become more engaged with your finances and put your plan together?

Laurie Renchik, CFP®, MBA, is a Partner and CERTIFIED FINANCIAL PLANNER™ professional at Center for Financial Planning, Inc.® With 20 years of industry experience, she specializes in proactive retirement planning and helping clients assess risk in their portfolios.


This material is being provided for information purposes only and is not a complete description, nor is it a recommendation. Any opinions are those of Laurie Renchik, CFP®, MBA and not necessarily those of Raymond James. The information has been obtained from sources considered to be reliable, but Raymond James does not guarantee that the foregoing material is accurate or complete. Investing involves risk and investors may incur a profit or a loss regardless of strategy selected.

Investment Commentary: Second Quarter 2019

Center for Financial Planning, Inc.® Investment Commentary 2019

Mid-Year update

As summer feels like it is finally underway after a soggy start, the markets have had anything but a soggy start to the year. The first half of 2019 ended on a strong note, as the U.S. and China seemed to resume negotiations with a constructive air. This is the best first half of the year the S&P 500 has experienced since 1997, as it posted a 18.54% gain.

Interest rates

Bonds have also enjoyed strong results this year, with the Barclays US Aggregate Bond Index up 6.11%. The Federal Reserve left rates unchanged again in June, but has made a complete about-face over the first half of the year, from projecting multiple interest rate increases to a majority of officials now thinking rates will be lower by year-end.  This comes on the heels of steady interest rate increases since 2015. The dispute over trade policy between the U.S. and China and imposition of tariffs is the main stimulus behind this thinking. This change by the Federal Reserve of wanting to reduce rates rather than raise rates (also referred to as a more dovish stance) has given a strong boost to domestic bonds as well as emerging market debt. The market has already priced in two interest rate cuts by year-end and two more in 2020. While this aggressive rate cut schedule may not fully play out (just as the three rate increases forecast for 2019 at the end of 2018 did not happen), the Federal Reserve has clearly signaled a softening economy.

Economic Snapshot

If you look at the economy and set aside the risks from the trade war, you see a pretty strong current picture; however, some of the positive signs are getting less and less positive. The expansion we have been in for so long could continue a while longer, but it seems to have less wind in its sails than it did just a year ago.

Retail Sales have come in very strong for the first half of the year, on the heels of some of the strongest readings on consumer confidence since the mid-2000s.

The Unemployment Rate, 3.6%, is at the lowest level since December 1969. The labor market remains very tight, and wages are increasing at a pace higher than inflation. This supports the high consumer confidence number and consumer spending, which is such a large part of our economy.

Inflation remains subdued with both headline and core CPI coming in at 2% or less, despite the pickup in wage inflation. Tariffs could start to increase pressure here, but we haven’t seen this flow through to the data yet.

Housing prices have been on the decline over the past year; however, the Federal Reserve’s recent change in stance on interest rates could give another slight temporary boon to this market.

Risks that could increase market volatility

Another breakdown in U.S. China trade negotiations, which could cause an abrupt pullback in markets. The tariffs in place now would start to have longer-term impact on inputs for producing goods. Businesses impacted by the tariffs would have to either cut costs elsewhere – think layoffs and discontinuing of capital expenditures – or pass the price increase along to the end consumer. Either way, this alone could start to push the economy into recession. This wildcard could have far-reaching impacts on our economy and we are closely watching developments..

The Federal Reserve not following through on cutting interest rates, as the markets are currently anticipating. The futures markets have priced in nearly four rate increases over the next 18 months. If the Fed doesn’t cut rates, we may see market rates back on the rise, meaning a short-term potential slowdown in bond returns and some headwinds for emerging market debt.

An escalation in tensions between the U.S. and Iran, which has started to affect oil prices in a negative way, although prices are still lower than they were a year ago. A sharp increase in oil prices affects consumer confidence and spending, while also putting pressure on inflation to the upside. Oil rising very quickly to high levels is often an early signal of recession

Our investment committee meets monthly and informally talks every day, if needed, regarding developments in headline risks and the economy. Sometimes, these discussions result in action, and sometimes, we take a wait-and-see approach, with an eye toward certain indicators. Right now, we continue to monitor the inversion of the yield curve, as well as the weekly initial claims for unemployment insurance from the Federal Reserve Bank of St. Louis. Both data points can be leading economic indicators that may give us some early warning signs. While we think the year should finish in positive territory, we remain cautious with our outlook for 2020.

We continue to hear great feedback on our new Client portal! We have a new instructional video to help you learn how to navigate if you are already using the portal, but also to let you know what information you could see by signing up. If you are interested, please reach out to us so we can send you the link to activate it!

On behalf of everyone here at The Center, we hope you enjoy the rest of your summer!

Angela Palacios CFP®, AIF®
Partner
Director of Investments

Angela Palacios, CFP®, AIF®, is a partner and Director of Investments at Center for Financial Planning, Inc.® She chairs The Center Investment Committee and pens a quarterly Investment Commentary.


Any opinions are those of financial advisor and not necessarily those of Raymond James. The information has been obtained from sources considered to be reliable, but we do not guarantee that the foregoing material is accurate or complete. The S&P 500 is an unmanaged index of 500 widely held stocks that is generally considered representative of the U.S. stock market. The Bloomberg Barclays US Aggregate Bond Index is a broad-based flagship benchmark that measures the investment grade, US dollar-denominated, fixed-rate taxable bond market. Indices are not available for direct investment. Any investor who attempts to mimic the performance of an index would incur fees and expenses which would reduce returns. Certified Financial Planner Board of Standards Inc. (CFP Board) owns the certification marks CFP®, CERTIFIED FINANCIAL PLANNER™, CFP® (with plaque design), and CFP® (with flame design) in the U.S., which it authorizes use of by individuals who successfully complete CFP Board's initial and ongoing certification requirements.

The Gambler

sell buy hold stocks

While I’m not a big country music fan, one of the few country songs I can sing along to is “The Gambler” by Kenny Rogers. While Kenny certainly knew how to make money, he also had a pretty good idea of how to keep it: “You gotta know when to hold ‘em, know when to fold ‘em, know when to walk away, and know when to run.” There’s a valuable lesson for investors in those lyrics. 

Most investors (and professionals, too) spend a lot of time deciding which investments to buy and little time understanding when to sell. It’s crucial to have a security selection process in place, and to understand what you own and why you own it, even if it is just an index mimicking strategy.

Part of your process, even before buying a security, should be to outline reasons you would hold the investment even through downturn periods. This can help you resist the temptation to sell in the wrong moments, for the wrong reasons. It is also important to establish factors that could cause you to sell.

At The Center, some of our reasons to potentially change strategies within a portfolio are: 

Security specific

  • Key personnel departure

  • Attainment of your price target

  • Increased correlation to other investments

  • Deviation from intended outcomes

  • Expenses

Goal specific

  • Change in circumstances (ie. entering retirement)

  • Change in risk tolerance

  • Change in the outcome needed to achieve long-term financial planning goals

Having these points in mind will make thinking about selling a position or changing your overall investment strategy (strategic allocation) easier and much less emotional. 

While it is usually best to buy and hold over longer periods of time, knowing when to hold ‘em and fold ‘em doesn’t come easily. But with some thought, you can make prudent decisions when you buy and when you sell, because you never want to have to walk away … or worse yet … have to run!

Angela Palacios, CFP®, AIF®, is a partner and Director of Investments at Center for Financial Planning, Inc.® She chairs The Center Investment Committee and pens a quarterly Investment Commentary.


Any opinions are those of Angela Palacios and not necessarily those of Raymond James. This material is being provided for information purposes only and is not a complete description, nor is it a recommendation. Investing involves risk and you may incur a profit or a loss regardless of strategy selected. Prior to making an investment decision, please consult with your financial advisor about your individual situation.

Can you roll your 401k to an IRA without leaving your job?

Nick Defenthaler Contributed by: Nick Defenthaler, CFP®

Can you roll your 401k to an IRA without leaving your job?

Typically, when you hear “rollover,” you think retirement or changing jobs. For the vast majority of clients, these two situations will be the only time they complete a 401k rollover. However, another option for moving funds from your company retirement plan to your IRA — the “in-service” rollover — is an often overlooked planning opportunity. 

Rollover Refresher

A rollover is simply the process of moving your employer retirement account (401k, 403b, 457, etc.) to an IRA over which you have complete control, separate from your ex-employer. If completed properly, rolling over funds from your company retirement plan to your IRA is a tax- and penalty-free transaction, because the tax characteristics of a 401k and an IRA generally are the same.  

What is an “in-service” rollover?

Unlike the “traditional” rollover, an “in-service” rollover is probably something unfamiliar to you, and for good reason. First, not all company retirement plans allow for it, and second, even when it’s available, the details may confuse employees. The bottom line: An in-service rollover allows an employee (often at a specified age, such as 59 ½) to roll a 401k to an IRA while employed with the company. The employee may still contribute to the plan, even after the completed rollover. Most plans allow this type of rollover once per year, but depending on the plan, you potentially could complete the rollover more often for different contribution types at an earlier age (sometimes as early as 55).

Why complete an “in-service” rollover?

While unusual, this rollover option offers some benefits:

More investment options: Any company retirement plan limits your investment options. You can invest IRA funds in almost any mutual fund, ETF, stock, bond, etc. Having options and investing in a way that aligns with your objectives and risk tolerance may improve investment performance, reduce volatility, and make your overall portfolio allocation more efficient.

Coordination with your other assets: Your financial planner can coordinate an IRA with your overall plan with much greater efficiency. How many times has your planner recommended changes in your 401k that simply don’t get completed? When your planner makes those adjustments, they won’t fall off your personal “to do” list.

Additional flexibility: IRAs allow penalty-free withdrawals for certain medical expenses, higher education expenses, first time homebuyer allowance, etc. that aren’t available with a 401k or other company retirement plan. Although this should be a last resort, it’s nice to have the flexibility.

Exploring “in-service” rollovers

So what now? First, always keep your financial planner in the loop when you retire or switch jobs to see whether a rollover makes sense for your situation. Second, let’s work together to see whether your current company retirement plan allows for an in-service rollover. That typically involves a 5-10 minute phone call with us and your company’s Human Resources department.

With your busy life, an in-service rollover may fall close to the bottom of your priority list. That’s why you have us on your financial team. We bring these opportunities to your attention and work with you to see whether they’ll improve your financial position! 

Nick Defenthaler, CFP®, is a CERTIFIED FINANCIAL PLANNER™ professional at Center for Financial Planning, Inc.® He contributed to a PBS documentary on the importance of saving for retirement and has been a trusted source for national media outlets, including CNBC, MSN Money, Financial Planning Magazine, and OnWallStreet.com.


Rolling over your retirement assets to an IRA can be an excellent solution. It is a non-taxable event when done properly - and gives you access to a wide range of investments and the convenience of having consolidated your savings in a single location. In addition, flexible beneficiary designations may allow for the continued tax-deferred investing of inherited IRA assets. In addition to rolling over your 401(k) to an IRA, there are other options. Here is a brief look at all your options. For additional information and what is suitable for your particular situation, please consult us. 1. Leave money in your former employer's plan, if permitted Pro: May like the investments offered in the plan and may not have a fee for leaving it in the plan. Not a taxable event. 2. Roll over the assets to your new employer's plan, if one is available and it is permitted. Pro: Keeping it all together and larger sum of money working for you, not a taxable event Con: Not all employer plans accept rollovers. 3. Rollover to an IRA Pro: Likely more investment options, not a taxable event, consolidating accounts and locations Con: usually fee involved, potential termination fees 4. Cash out the account Con: A taxable event, loss of investing potential. Costly for young individuals under 59 ½; there is a penalty of 10% in addition to income taxes. Be sure to consider all of your available options and the applicable fees and features of each option before moving your retirement assets. Any opinions are those of Nick Defenthaler and not necessarily those of Raymond James. This material is being provided for information purposes only and is not a complete description, nor is it a recommendation. Investing involves risk and you may incur a profit or a loss regardless of strategy selected. Prior to making an investment decision, please consult with your financial advisor about your individual situation. Please note, changes in tax laws may occur at any time and could have a substantial impact upon each person's situation. While we are familiar with the tax provisions of the issues presented herein, as Financial Advisors of RJFS, we are not qualified to re tax or legal matters with the appropriate professional. 401(k) plans are long-term retirement savings vehicles. Withdrawal of pre-tax contributions and/or earnings will be subject to ordinary income tax and, if taken prior to age 59 1/2, may be subject to a 10% federal tax penalty. Roth 401(k) plans are long-term retirement savings vehicles. Contributions to a Roth 401(k) are never tax deductible, but if certain conditions are met, distributions will be completely income tax free. Unlike Roth IRAs, Roth 401(k) participants are subject to required minimum distributions at age 70.5.

Investment risk is real. Here’s how we manage it.

The Center Contributed by: Center Investment Department

Investment risk is real. Here's how we manage it.

Investment risk is real. Every day. Every year. In up and down markets. Even in good times – when, for example, U.S. Equities are performing well – we all can use this friendly reminder:

The management of investment risk is constant in successful investing.

Benjamin Graham, known as the “father of value investing,” dedicated much of his book, The Intelligent Investor, to risk. In one of his many timeless quotes, he states, “The essence of investment management is the management of risks, not the management of returns.” To many investors, this statement may seem counterintuitive. Rather than an alarm, though, risk may serve as a healthy dose of reality in all investment environments.

Our Take on Risk

How do we at The Center attempt to manage risk as we steward approximately $1.1 billion in assets? We:

We have been managing client assets for more than 34 years. We fully understand and appreciate the importance of investment returns. We also know that risk is an important element when constructing portfolios intended to fund some of life’s most important goals, such as sending a child or grandchild to college, funding a long and successful retirement, having sufficient funds for long-term health needs, and passing a legacy to loved ones.

While no one can guarantee future investment returns, our experience suggests that those who follow our risk management tactics may better stay on track with their financial plans. 

If you are a client, we welcome the opportunity to talk more about how your portfolio is constructed. Not a client? We’d enjoy the opportunity to share our experience and review your goals and risk.


Any opinions are those of Center for Financial Planning, Inc.® and not necessarily those of Raymond James. This material is being provided for information purposes only and is not a complete description, nor is it a recommendation. Investing involves risk and you may incur a profit or a loss regardless of strategy selected. Prior to making an investment decision, please consult with your financial advisor about your individual situation.

2019 First Quarter Investment Commentary

2019 First Quarter Investment Commentary

I love this time of year. In Michigan, the sun starts shining, and we slowly start to come out of our winter hibernation. It is only this time of year when wearing shorts on a sunny, 45-degree day seems completely logical.

I am always surprised by how different March can be from beginning to end; the old saying I learned in first grade, “March comes in like a lion and goes out like a lamb,” is rarely wrong. It makes me think about how the first quarter of 2019 has come in like a lion and ended like a lamb. 

Much volatility marked the end of 2018. During the last quarter of the year, markets experienced a very sharp correction, pulling back almost 20% from peak to trough for the S&P 500. Then as 2019 ramped up, markets quickly recovered, and the 2018 correction became a distant memory nearly erased from our statements, melting away like the ice from all of those winter storms.

Through the first quarter of the year, the S&P 500 rallied over 13.5%, the MSCI EAFE returned nearly 10%, and the Barclay’s Aggregate US bond index earned a respectable 2.94%.

While the downside in most cases has been nearly recovered for a diversified portfolio, some scars remain and red flags of a weakening economy are popping up (no, they aren’t the kind of flags you see on the golf course).

Yield Curve Inversion?

You may have seen headlines debating the inversion of the yield curve. This is a highly watched recession indicator. Throughout 2018, the yield curve flattened as The Federal Reserve raised interest rates. This year, the flattening has slowly morphed into a potential inversion. In the yield curve chart below, on the left, you can see that very short term rates are higher than even the 10-year treasury rate. However, longer-term rates are still higher, and the two-year yield is not yet more elevated than the 10-year yield, which is the true definition of the inversion. The chart on the right shows how the yield curve looked leading into the 2008-2009 recession. You can see that the long-term rates were no longer upward sloping, but rather flat-to-downward sloping.

 
Source: https://stockcharts.com/freecharts/yieldcurve.php

Source: https://stockcharts.com/freecharts/yieldcurve.php


The yield curve isn’t a perfect indicator, as it does from time to time give false signals that are not followed by a recession. However, the flattening and inversion of the yield curve do indicate a shaky economy that is more susceptible to outside shocks.

Many argue this is not a true inversion, and only time will tell. But this indicator does cause us to think a recession could be coming. If the inversion increases, caused most likely by long-term rates falling farther, that would increase our certainty. However, a recession generally follows an inversion by nine months to a year.

The delay happens because an inversion causes banks to tighten their lending standards. Banks make money by lending at a higher long-term rate, paying us on our short-term cash at a lower rate, and keeping the difference as profit. Paying us at a higher rate and loaning at a lower rate makes loans far less profitable. With no room for error in making a bad loan, bank standards become very strict. This alone slows the economy in many ways.

Raymond James Chief Economist Scott Brown recently cited the chart below: “In a simple model of recessions, the current spread between the 10-year Treasury note yield and the federal fund’s target rate implies about a 30% chance that the economy will enter a recession in the next 12 months. At this point, a broad-based decline in economic activity does not appear to be the most likely scenario, but the odds are too high for comfort and investors should monitor the situation closely in the months ahead.” (Source: http://beacon1.rjf.com/ResearchPDF/2019-03/a514efab-1484-4425-9c7a-9db0e0689423.pdf)

 
20190416c.jpg
 

Auto loans showing signs of concern

Auto loans, which hit us close to home in Michigan, have shown early warning signs of trouble. Despite a low unemployment rate and growth in the economy, many people still struggle to pay their bills. As of February, seven million Americans were at least three months behind in their car payments. While the government shut down may be a contributing factor, that is still a shocking statistic and one million consumers higher than in 2010, the last peak coming out of the great recession. The loans in arrears based on percentage don’t look quite as shocking, but the numbers are creeping higher.

 
20190416d.jpg
 

While these and other red flags signal an economic slowdown, we are not yet ready to confirm they signal a recession. Our investment committee is discussing areas of concern within portfolios and where we may want to make adjustments. Areas considered ripe for change include the bond positions.

We have an overweight to what we call “strategic income”, higher yielding positions that carry more credit risk than interest rate risk. While this overweight has worked for many years, we may soon reduce it back to our long-term target and add this into the Core bond portion of the portfolio. Core bonds tend to behave positively in turbulent markets and benefit from the “flight to safety” trade.

Within the core bond space, we have held shorter duration bonds which, during a rising interest rate environment, have less downside pressure as rates rise. Now that the Fed has signaled an end to raising rates for the time being, we have also looked at taking on more duration risk in that portion of the portfolio. When equity markets correct, longer duration bonds tend to perform more positively.

Headline updates:

Brexit receives an extension as Parliament in Britain seized control of the process when the Prime Minister failed, yet again, to put forth a plan lawmakers could support. This resulted in an extension until April 12; in all likelihood, another will be granted.

The Mueller investigation results have come to a close. According to Ed Mills, Raymond James Managing Direct of Washington Policy, “The conclusion of Special Counsel Robert Mueller’s investigation finding no coordination or collusion with the Trump campaign related to Russian election interference, and a Department of Justice verdict seeing no case for obstruction, offers a significant near-term political boost to President Trump, alleviating one of the big unknown DC policy risks on the market. It also has the potential to have a real impact on the President’s remaining first-term agenda, particularly on trade negotiations with China or domestic issues such as the budget or infrastructure.” (Source: http://beacon1.rjf.com/ResearchPDF/2019-03/e0fc4341-4031-486e-a5fa-bcf05d9d7c2b.pdf)

The Federal Reserve officially paused its rate-hiking cycle through 2019. The Fed also has decided to slow, and eventually stop, reducing its balance sheet by selling off the Treasuries it owns. Low rates for longer terms seems to be the theme for the near future. This affects how we will position our bond portfolios. The investment committee will this month discuss the potential of adding more duration to our core bond portfolio. This area also tends to behave positively during market pullbacks and recessions and, usually, the more duration, the better.

Trade talks with China seem to be moving in the right direction, with very slow progress. This will likely continue to hang over the markets for months to come. The next leg up of the equity markets could depend on progress here.

Negative yields around the world again, still? As of the end of February, 17% of the world’s investment-grade debt is trading with negative yields. In Europe, as of the end of March, more than 40% of government debt was trading at a negative yield – making U.S. bonds still the best kid on the block. (Source: Natixis) 

If you are interested in learning more about our process, please don’t hesitate to reach out with a phone call or email or visit the investment management page of our website. We thank you for your continued trust in us!

Angela Palacios, CFP®, AIF®
Partner
Director of Investments

Angela Palacios, CFP®, AIF®, is a partner and Director of Investments at Center for Financial Planning, Inc.® She chairs The Center Investment Committee and pens a quarterly Investment Commentary.


Any opinions are those of Angela Palacios and not necessarily those of Raymond James. The information contained in this report does not purport to be a complete description of the securities, markets, or developments referred to in this material. There is no assurance any of the trends mentioned will continue or forecasts will occur. The information has been obtained from sources considered to be reliable, but Raymond James does not guarantee that the foregoing material is accurate or complete. The case study included herein is for illustrative purposes only. Individual cases will vary. Prior to making any investment decision, you should consult with your financial advisor about your individual situation. Any information is not a complete summary or statement of all available data necessary for making an investment decision and does not constitute a recommendation.

The S&P 500 index is comprised of approximately 500 stocks and is widely seen to be representative of the U.S. market as a whole. The MSCI EAFE index is designed to measure developed market equity performance, excluding the United States & Canada. The EAFE consists of the country indices of 22 developed nations. The Bloomberg Barclays US Aggregate Bond Index is a broad-based index that measures the investment grade, US dollar-denominated, fixed-rate taxable bond market. These indexes are unmanaged and cannot be invested into directly. Past performance is no guarantee of future results.