Investment Perspectives

Q1 2024 Investment Commentary

Print Friendly and PDF

As the 4-year anniversary of the Covid stock market correction came and went last month, markets have given historians and economists much to reflect on. Since the consumer is the major driver of the U.S. economy, the aftereffects of the COVID-19 pandemic stay-at-home policies and the economic reopening policies meant it has taken several years for a recession to roll through the economy. This uncorrelation of the sector effects has made this business cycle feel quite different. For example, when staying at home, we shifted our spending to either saving money or spending on goods rather than services, causing a major recession and unemployment in the services industry (remember when we couldn’t travel and instead spent our money on things like a Peloton!). Once herd immunity was achieved, we shifted our spending patterns from goods to services and travel, causing recessionary characteristics to roll through the manufacturing industry. This lack of synchronization has caused the NBER (National Bureau of Economic Research) to not call a recession here in the U.S. even though we met the official definition of one back in 2022 of two negative quarters of GDP growth (Gross Domestic Product).

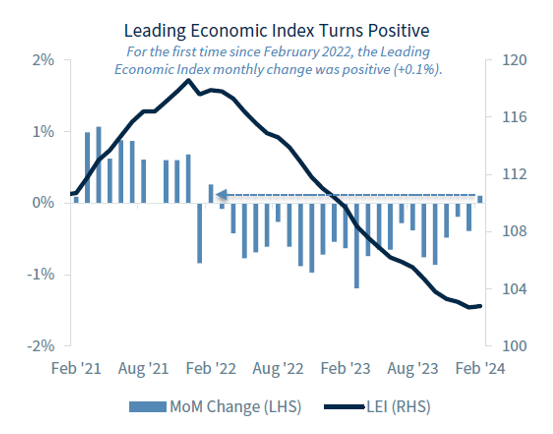
Recently, the manufacturing numbers, as measured by the ISM index (a leading economic indicator), finally climbed out of recessionary territory (below 50 readings) after a 16-month continuous streak of contractions. This is the longest contractionary steak since 2002! If you couple this with a recovery in new home building permits (another leading indicator), it looks more and more likely that the Federal Reserve has been successful in engineering a soft landing. The Conference Board Leading Economic Index also rose in March for the first time in two years!

The stock market agrees as the year has started out very strongly, with U.S. stocks up over 10.5% as measured by the S&P 500, U.S. small company stocks up 5.2% as measured by the Russell 2000, and International stocks up 5.78% as measured by the MSCI EAFE. Bonds were off to a slower start, down .78%, as the market reset expectations of the number of interest rate hikes that are likely to occur this year.

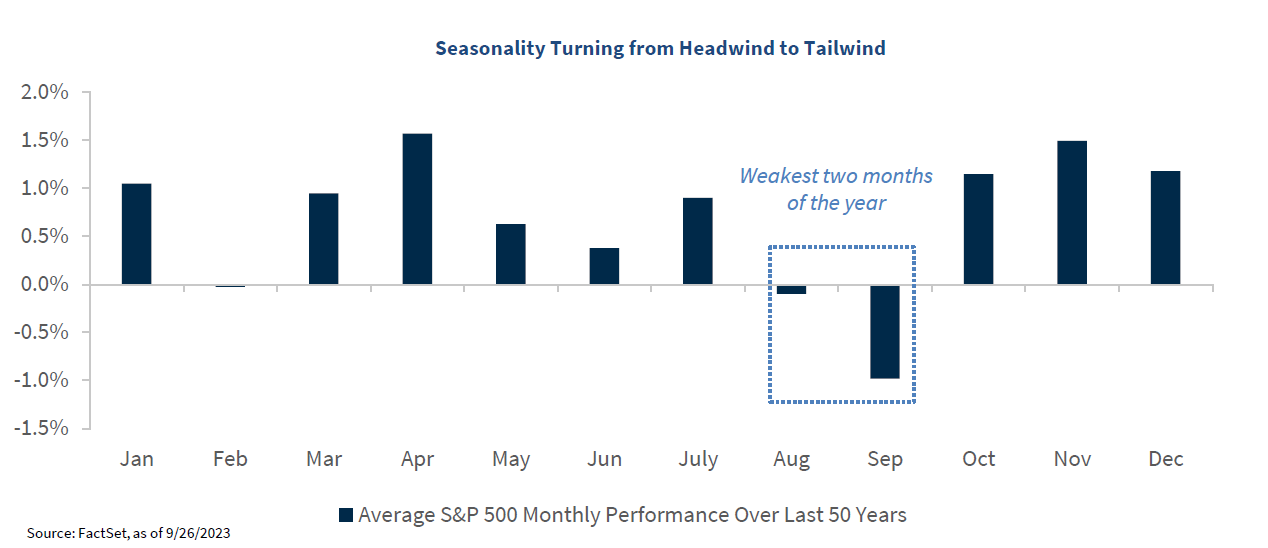
As the S&P 500 hits new highs, it is natural that you might be wondering if the market is too expensive. Investing at all-time highs seems like the wrong time to add to your investments. Check out my recent blog for some interesting statistics on forward returns when investing on days the market is making a new high. The moral of the story, though, is that while valuations are expensive, they do NOT necessarily mean the market will crash tomorrow, next quarter, or even next year. Current valuations are usually a poor indicator of how markets will perform in the short run. It is important to set reasonable expectations of future market returns. This is not the same market we have seen over the past couple of years driven by a few concentrated names. Returns have broadened across the benchmark, and political headlines may start to creep into market performance in the short term.

Investing by Political Party: A Long-Term Perspective

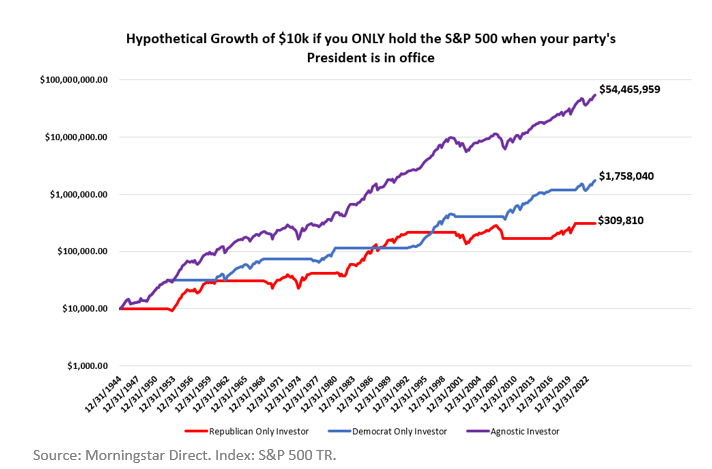
What if you ONLY invest in the stock market when your president is in office? Over the past 80 years, the political party-agnostic investor beats the democrat and republican by ~3,000% and ~17,500%!

OK, this may fall under the “lying with statistics” category, but I think it still illustrates two very important points. Stocks don’t grow because of political parties, and time in the market is the single most important factor in growing your investment. 

Let’s consider three hypothetical investment strategies starting with $10,000 in 1945:

  1. Republican Only Investor: puts 100% of their money into the S&P 500 when the president is a Republican, otherwise hides their money under their mattress.

  2. Democrat Only Investor: puts 100% of their money into the S&P 500 when the president is a Democrat, otherwise hides their money under their mattress. 

  3. Agnostic Investor: puts 100% of their money into the S&P 500 the entire time.

The results may shock you. The “Republican Only” investor ends up with ~$309k, the “Democrat Only” investor ends up with ~$1.75M, and the “Party-Agnostic” investor ends up with a whopping ~$54.5M.

Obviously, this hypothetical is a bit outlandish for a few reasons. It has an 80-year time horizon, which is much longer than most people are seriously investing. It is an all-or-nothing strategy that puts all its eggs in one basket or the other. One of those baskets earns 0% (which isn’t realistic if you compare it to money markets or short-term treasuries over time). And lastly, it might lead one to confuse correlation and causation when looking at the Democratic/Republican gap.

It would be easy to point to this as confirmation that the Democratic party is better for stocks, but digging a little deeper makes it less clear. The lead changes throughout history – if we wrote this in the 1990s, someone could point to it as confirmation for the Republican party and stock performance. Aside from that, the gap comes from two very distinct decades: the 2000s that gave investors one of the worst decades of stock returns in history, and the 2010s that gave investors one of the best. Lively debates are still happening today over what caused the Tech Bubble, the Great Financial Crisis, and subsequent recovery – but there were certainly more factors than one. In the long run, stocks grow because earnings grow, and earnings have much more to do with innovation and economic growth than those sitting in the Oval Office.

The second and even more important point is that the best way to partake in those growing stock earnings is, unsurprisingly, to invest in stocks! The chart below uses the same data as the previous chart but only shows the time each investor invested in stocks. Each party held office for almost exactly half of the time, so missing out on the other half was a HUGE detriment to results for both investors.

The Fed, Interest Rates, and Bond Returns

The Fed ended the fastest rate hike cycle in history last summer when they made the final hike to 5.25-5.5%. Since then, the bond market has been trying to pinpoint exactly when the first interest rate CUT would come. March? June? Later? Expectations have been shifting later than initially predicted. You can see that in the rising interest rates the past few months – the 1-year treasury rate was around 4.7% in January but back to 5% by the end of the quarter. What does all this ACTUALLY mean for bond investors, though?

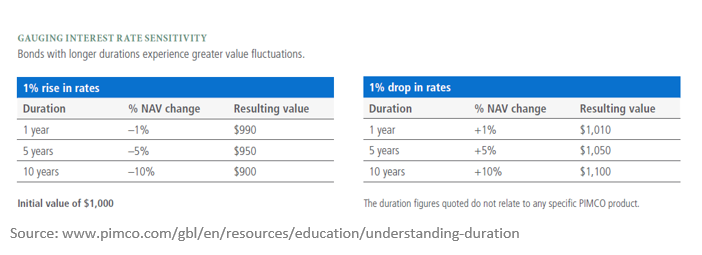
Well, the Fed doesn’t control the entire yield curve – they only have a direct impact on the shortest durations of bonds at the front end of the curve. If you are invested in those short duration bonds, you will probably see the yields fall as the Fed cuts, but the prices of short duration bonds do not move nearly as much as longer duration bonds. Money market funds, for example, have become very popular over the past two years as rates have increased. Roughly speaking, if the Fed cuts rates from 5.5% to 4.5% over the next year, a money market investor would likely see their yield fall a similar 1% but wouldn’t see any price appreciation (they also wouldn’t likely see any price DEPRECIATION if yields were to rise).

Intermediate and long-term bond investors have more factors to consider because those durations are much more volatile and move with longer term economic growth expectations as well as inflation expectations. Just because the Fed cuts rates does not necessarily mean that the 10-year rate would also decrease. BUT if it did, that investor would see significant price appreciation. The flip side to that, as we all saw in 2022, is that those investors saw significant price depreciation as rates rose.

So, What May Be Coming This Quarter?

  • Presidential Primary races will continue throughout this quarter, concluding in early June, but with all opponents dropping out of the race, it looks like we will repeat the 2020 election of Donald Trump and Joe Biden. Market driving election headlines are likely to be minimal for now but may start to play into market performance in the short term. Holding the cash you may need in the next year, lengthening the duration of our bonds – to potentially offset equity market volatility, and rebalancing are all tools we are deploying to take advantage of or insulate against short-term market volatility.

  • Next month, the SEC will shorten the standard trade settlement cycle from two business days to one business day after the trade date. This reduces the time between when a sale of a security occurs and when the proceeds are cleared for withdrawal.  

  • Portfolio spring cleaning? Much like moving through the rooms in your house with a critical eye, the investment committee is focused on reviewing asset classes within the portfolio. We are focused on extending the duration of our bond portfolio with a partial change having already occurred. We will also be doing a deep dive into our international investments. 

We are grateful for the opportunity to guide you throughout your investment journey. If you ever have any questions, don’t hesitate to contact us!

Angela Palacios, CFP®, AIF®, is a partner and Director of Investments at Center for Financial Planning, Inc.® She chairs The Center Investment Committee and pens a quarterly Investment Commentary.

Nicholas Boguth, CFA®, CFP® is a Senior Portfolio Manager and Associate Financial Planner at Center for Financial Planning, Inc.® He performs investment research and assists with the management of client portfolios.

The Composite Index of Leading Indicators, otherwise known as the Leading Economic Index (LEI), is an index published monthly by The Conference Board. It is used to predict the direction of global economic movements in future months. The index is composed of 10 economic components whose changes tend to precede changes in the overall economy.

Any opinions are those of the Angela Palacios, CFP®, AIF® and Nicholas Boguth, CFA®, CFP® and not necessarily those of Raymond James. The information contained in this report does not purport to be a complete description of the securities, markets, or developments referred to in this material. There is no assurance any of the trends mentioned will continue or forecasts will occur. The information has been obtained from sources considered to be reliable, but Raymond James does not guarantee that the foregoing material is accurate or complete. Any information is not a complete summary or statement of all available data necessary for making an investment decision and does not constitute a recommendation. Investing involves risk and you may incur a profit or loss regardless of strategy selected. The S&P 500 is an unmanaged index of 500 widely held stocks that is generally considered representative of the U.S. stock market. The MSCI EAFE (Europe, Australasia, and Far East) is a free float-adjusted market capitalization index that is designed to measure developed market equity performance, excluding the United States & Canada. The EAFE consists of the country indices of 22 developed nations. The Bloomberg Barclays US Aggregate Bond Index is a broad-based flagship benchmark that measures the investment grade, US dollar-denominated, fixed-rate taxable bond market. Keep in mind that individuals cannot invest directly in any index, and index performance does not include transaction costs or other fees, which will affect actual investment performance. Individual investor's results will vary. Past performance does not guarantee future results. Diversification and asset allocation do not ensure a profit or protect against a loss. Investing involves risk and you may incur a profit or loss regardless of strategy selected. Past performance is not a guarantee or a predictor of future results. Raymond James and its advisors do not offer tax or legal advice. You should discuss any tax or legal matters with the appropriate professional.

Q4 2023 Investment Commentary

 
Print Friendly and PDF

There were many reasons the fourth quarter of 2023 could have been weak. After two years of revenge spending of pent-up household COVID savings, the consumer seemed like they could have run out of steam, but the Christmas spending season was strong, and consumer confidence grew. The strength in the labor market has slowed down, and jobs are being added at a slower pace, but unemployment is creeping down and not up. While much of the population is still enjoying their low mortgage or auto loan rates that have been locked in, those forced to move into a new home or buy new automobiles are feeling the crunch of higher interest rates. Student loan debt became payable again just ahead of the holiday season while all insurance premiums are on the rise.

Despite all these reasons, we saw one of the strongest fourth quarters on record regarding returns. While returns were narrow early in the year, driven by AI-related hype, the second half of the year has been about inflation coming under control and, thus, a halt in interest rate increases for the last quarter. A typical 60% Stock/40% Bond diversified portfolio ended the year up around 15%, led by the strong growth of U.S. large stocks with some of the best returns of any major asset class at +26% for the year (Example 60/40 portfolio represented by 40% Bloomberg US Aggregate Bond TR, 30% S&P 500 TR, 15% MSCI EAFE NR, 10% Russell 2000 TR, and 5% MSCI EM NR). International stocks underperformed the U.S. but also had a strong year, up around 18%, and U.S. aggregate bonds finished the year positively at 5.5%, thanks to falling yields and tighter spreads.

Recession?

A year ago, the media was full of recession buzz. The S&P 500 experienced a peak-to-trough drawdown during 2022 of 24%, which usually signals a mild recession (stock market reaction usually happens ahead of an economic recession). But just because we didn’t experience a traditional recession, defined as two-quarters of negative Gross Domestic Product Growth in a row, doesn’t mean various sectors didn’t have periods of contraction. Capital Group shared an interesting perspective recently that the economy experienced recessions within multiple industries; they just didn’t align simultaneously. No doubt another hangover anomaly from the COVID shutdown and subsequent highs from the government infusion of cash. The common thread over the past couple of years was the resiliency of the jobs market. As long as people are as employed as they want, money continues to flow into their pockets for spending. Consumer spending is the largest component of our economy, and a strong job market means the economy should continue to grow and avoid recession.

U.S. Dollar

The U.S. Dollar weakened somewhat versus a basket of other currencies from the beginning of the year. This has served as a tailwind for international investing. Some of the weakening came late in the fourth quarter after the Federal Reserve indicated their desire to start cutting rates in the U.S. before other developed market economies would start. The differential between interest rates in the U.S. versus other economies worldwide is a driver of the strength or weakness of the dollar. If the rate differential narrows, meaning rates in the U.S. start to come down while rates stay higher in other areas of the world, making the yields similar, whether here or abroad, would weaken the U.S. dollar. This coupled with slowing inflation will likely continue to impact the dollar strength.

Source: JP Morgan Guide to the markets 11/30/23

Inflation and Interest Rates

Speaking of inflation…It appears that inflation is back down to long-term averages and continuing to drift downward. The chart below shows headline inflation (blue) and core CPI, the Federal Reserve’s preferred measure, as it strips out volatile items like food and energy in the short term. Shelter and services are the two areas of the economy that are still driving inflation. If inflation remains under control, this gives the Federal Reserve more leeway in cutting interest rates next year. 

Government Fiscal Situation

While we, as consumers, have applauded higher yields for over a year, interest outlay on the national debt is rising. Doubling from just a few years ago, interest payments now total approximately 14-15% of tax revenues. The 1990s is the last time we saw levels like this. Likely, this has yet to peak as debt continues to mature and be re-issued at higher interest rates. The level of debt continues to increase at what seems to be an unsustainable pace, too. The amount of debt per capita is nearly $100,000 for the first time. That means the government is $100,000 in debt per person in the United States. There are several ways to reduce or slow the growth: strong GDP growth, increasing immigration, spending cuts, and increased taxes (fiscal policy).

At the December Federal Reserve meeting, the FED confirmed that they are intending on rate cuts in 2024 rather than any more rate increases. The data is supporting this move. Rate reductions should help to slow the stress on interest payments for the government. This has certainly impacted consumer mortgage rates as they are falling from their peak.

You might have heard that there is an election in 2024. Some major topics of debate will make headlines in the coming months, including international policy, the impact of inflation, the growing national debt, and many key social issues.  

While it is nearly a year away, you may be anxious about how it will impact investments. A volatile campaign season and close vote can create uncertainty for markets. But, historically, election years have favored patient investors even though they may be volatile. For long-term investors, the political party holding the White House has had little impact on returns. Check out the chart below. You can see that returns for the S&P 500 have, on average, been similar regardless of who holds this office.

No doubt 2024 will be interesting. Not only are we facing a major election, but 40 national elections are happening worldwide (Russia, India, the U.K., South Africa, and Taiwan, to name a few)! That is more than 40% of the world’s population. Since a year can be a lifetime in politics, in addition to our February investment update, we will be doing a special election update in the fall to shed light on the progression of this process and how it may be impacting investments in the short run.

Portfolio Construction: Thinking Differently for the Coming Year

We are coming off two years that were full of surprises. Nobody saw the fastest rate hike cycle in history coming in 2022, leading to one of the worst stock and bond years. To follow that up, nobody predicted that the U.S. stock market would be positive over 25% in 2023. While your core investment philosophy should not change from year to year, the market is constantly changing and may provide short-term opportunities to keep on your radar. Lately, it feels as though those market changes are happening faster than ever. A few things that we are keeping on our radar that might drive opportunities for tweaks in portfolios are:

Inflation: Is high inflation behind us? How will the Fed react?

  • Think about shifting in or out of real assets, commodities, and TIPS.

Interest Rates: Are we leaving a rising rate environment and entering a falling rate environment?

  • Think about targeting certain maturities in bond portfolios.

Elections: Are there key policy shifts that may drive market trends for years? 

  • Think about an overweight or underweight to certain sectors in both stocks and bonds and use election volatility as a rebalancing opportunity throughout the year.

Valuations: Have international, small-cap stocks, or the value style become cheap enough to expect outperformance?

  • Think about shifting from the more expensive asset class to the discounted one. 

Dollar Strength: The dollar was in a bull market for almost 15 years, but are we in the early innings of a turnaround?

  • Don’t give up on international investing. Think about underweighting U.S. dollar assets and adding to international.  

While these themes, and surely many others, will play out through the next year and potentially provide opportunities to take advantage of – our underlying philosophy will not change. We will focus on fundamentals and stick to our process. Headlines might cause investors to overreact one way or the other, but rather than get swept up in the news cycles, we will use those opportunities to rebalance and stick to our long-term investment goals.

Lastly, there is one additional change coming in May of 2024. The SEC is shortening the standard trade settlement cycle from two business days after the trade date to one business day after the trade date. This reduces the time between when a sale of a security occurs and when the proceeds are cleared for withdrawal. Remember years ago when settlement took three days? Will there ever be a zero-day settlement? Only time will tell. As technology improves and processes can be completed more efficiently, we see benefits like this!

Stay tuned for the invitation to our annual economic and investment update coming soon! There will be both an in-person event and a webinar!

Angela Palacios, CFP®, AIF®, is a partner and Director of Investments at Center for Financial Planning, Inc.® She chairs The Center Investment Committee and pens a quarterly Investment Commentary.

Example 60/40 portfolio represented by 40% Bloomberg US Aggregate Bond TR, 30% S&P 500 TR, 15% MSCI EAFE NR, 10% Russell 2000 TR, and 5% MSCI EM NR.

Any opinions are those of the Angela Palacios, CFP®, AIF® and not necessarily those of Raymond James. The information contained in this report does not purport to be a complete description of the securities, markets, or developments referred to in this material. There is no assurance any of the trends mentioned will continue or forecasts will occur. The information has been obtained from sources considered to be reliable, but Raymond James does not guarantee that the foregoing material is accurate or complete. Any information is not a complete summary or statement of all available data necessary for making an investment decision and does not constitute a recommendation. Investing involves risk and you may incur a profit or loss regardless of strategy selected. The S&P 500 is an unmanaged index of 500 widely held stocks that is generally considered representative of the U.S. stock market. The MSCI EAFE (Europe, Australasia, and Far East) is a free float-adjusted market capitalization index that is designed to measure developed market equity performance, excluding the United States & Canada. The EAFE consists of the country indices of 22 developed nations. The Bloomberg Barclays US Aggregate Bond Index is a broad-based flagship benchmark that measures the investment grade, US dollar-denominated, fixed-rate taxable bond market. Keep in mind that individuals cannot invest directly in any index, and index performance does not include transaction costs or other fees, which will affect actual investment performance. Individual investor's results will vary. Past performance does not guarantee future results. Diversification and asset allocation do not ensure a profit or protect against a loss. Investing involves risk and you may incur a profit or loss regardless of strategy selected. Past performance is not a guarantee or a predictor of future results. Raymond James and its advisors do not offer tax or legal advice. You should discuss any tax or legal matters with the appropriate professional.

Q3 2023 Investment Commentary

Print Friendly and PDF

The third quarter of the year has brought some downside volatility with it. While it can be concerning when opening your statement, it is important to remember that minor pullbacks are very normal throughout the year. August and September are, historically, the toughest months on average for markets, as shown by the chart below. The good news is that the last quarter of the year tends to be one of the strongest on average.

Over the past quarter, investor mood has shifted. The S&P 500 ended the quarter down 2.08%. A diversified portfolio ended the quarter down 2.63% if using a simple blended benchmark of (40% Barcap Aggregate Bond index, 40% S&P 500, and 20% MSCI EAFE International index). Quarters like this make it challenging to remember why you want to continue holding a diversified portfolio. Periods like that of 2000-2008 are a distant memory for most investors (and many have never experienced investing when U.S. markets and technology companies have struggled). If you dissect the returns of the S&P 500 year to date, you can see that most of the returns have come from the media dubbed “Magnificent Seven.” In reality, the remaining 493 companies in the S&P have contributed only about 2% of the positive 13% in year-to-date returns. The chart below shows how just these seven companies are responsible for most of the returns.

Source: Morningstar Direct

Maintaining a balanced approach to investing is important, as most of us are investing over a lifetime. While diversification may not always work over short periods of time, studies show it to be a successful strategy over the long term.

What contributed to volatility this quarter?

Higher intermediate and long-term interest rates have spelled trouble for equity valuations recently. The Federal Reserve (the Fed) did not raise rates in September but signaled that they are likely to raise one more time this year and are unlikely to cut rates in early 2024. This has caused longer-term bond rates to increase drastically over the summer (about 1%). We have continued to maintain our allocation to short-duration bonds, which has helped over that time period.

Higher interest rates contribute to equity volatility because investors view all asset classes through a risk/reward lens when determining where best to deploy money. When interest rates are low, investors are incentivized to reach for yield in equities as they pay an attractive dividend (more than treasury bonds were paying for a long time!). You also have the added upside potential of capital appreciation. When you can get interest above 5% in a money market or CD with extremely low risk, investors are less incentivized to invest money into equities, as most of the return needed to achieve long-term goals can be earned with little to no risk! Rates usually don’t stay elevated like this for very long. On average, the period between the last interest rate increase by the Fed and the first interest rate cut is nine months in historically similar periods. So don’t expect these high rates with no risk to stay around long.

Political brinksmanship is yet again holding the economy hostage to further both sides’ political agendas. The government averted a shutdown with only hours left but kicked the can down the road, so we may hear about this again in November. Like with the debt ceiling, we have been here before. The good news is, generally, shutdowns don’t coincide with recessions. There is a lot of noise and, usually, short-term volatility but not a longer-term impact on markets or the economy. The longest shutdown was 35 days at the end of 2018. While it created some temporary market fluctuation, it did not cause a larger economic issue. At that time, the economy contracted about .2% that quarter but got that back the following quarter because government employees get back pay once things open back up. Moody’s, the final of the big three debt ratings agencies to have the U.S. rated AAA, is questioning their AAA rating on U.S. government debt because of the behavior of the politicians. 

Economic Growth is slowing

While Taylor Swift’s Eras Tour is coming to a close and noticeably adding to the local GDP of the cities she performs in, the rest of the economy might be better described by her song “Death By A Thousand Cuts.”

The consumer is out of extra money (one can only buy so many $90 concert t-shirts). The chart below shows how families had stockpiled excess earnings and government transfer payments from the COVID shutdown but have spent this excess savings over the past two years.

The UAW strike will continue to impact numbers like the above chart. As the strike expands, so does the risk of increased shutdowns and layoffs spread throughout the economy. It remains to be seen how long the strike will continue and, thus, how much of a negative impact on GDP it will have. While this strike will have economic consequences, it is only one industry. While there could be spillover if it goes on long enough (for example, people may go out to eat less if they are on strike and not earning their full wages), the UAW strike shouldn’t single-handedly be the cause of a recession.

Home affordability will continue to be hurt by high-interest rates.

Student loan payments restart in October, pulling more money out of the consumer’s pocket.   

Jobs are strong, but job openings are pulling back.

These items, or something yet unknown, could be the tipping point for the economy to turn over into recession in early 2024. Most don’t realize we have already been in an earnings recession this year. This is classified as two or more quarters of contraction in earnings from the prior year. S&P 500 companies have experienced this as a whole this year. Equity markets are certainly spooked about this and are reacting accordingly now, even as the Fed tries to engineer a “soft landing.”

What is a soft landing?

In short, very rare. Ideally, the Fed will stifle GDP growth enough with higher rates to bring down inflation but not stifle so much that growth turns negative. Rather, it just slows down, avoiding a recession. They are counting on the strength of the labor market to remain, keeping the economy out of recession. Only time will tell if the Fed will need to keep rates higher for longer to put the inflation genie back in the bottle. They have come a long way in fighting inflation, as it was just a year ago that we were talking about 9% inflation, and now we are below 4%. The easy sources of inflation have been targeted and curbed (think supply chain shortages), so now it is time to let high interest rates work their magic throughout the economy.

Politics

The Speaker of the House, Kevin McCarthy, was ousted in a 216-210 vote, with 8 Republicans joining the unified Democratic vote. Patrick McHenry is serving as the temporary speaker, who is well respected in the house and should provide good leadership for now. Since we are well into the congressional term, proceeding without a formal leader shouldn’t be too disruptive to normal functioning as committees have already been formed and a rules process adopted. Electing a new speaker will, however, take valuable time away from working on funding the government past the November 17th deadline.

The media coverage is starting to pick up for the election in 2024. Undoubtedly, headlines will only pick up later this year and throughout next year. While there is no shortage of negative headlines during an election year, they tend to be positive for markets. Markets don’t care which party controls the white house. I think many view Republicans as being more pro-business and assume that returns will be far better than when a Democrat holds the office, but that isn’t true. The S&P 500 has gone up regardless of who holds the office most of the time. This is because markets focus far more on what is going on with the economy than on politics. American companies find ways to be innovative and successful regardless of who is leading the country.    

While all of this noise can create market volatility, keeping your long-term goals in mind is more important than ever. We do not generate future forecasts; rather, we trust in the journey of financial planning and a disciplined investment strategy to get us through the more challenging times and stay the course. We appreciate the continued trust you place in us and look forward to serving your needs in the future.

Please don’t hesitate to contact us for any questions or conversations!

Angela Palacios, CFP®, AIF®, is a partner and Director of Investments at Center for Financial Planning, Inc.® She chairs The Center Investment Committee and pens a quarterly Investment Commentary.

Any opinions are those of the Angela Palacios, CFP®, AIF® and not necessarily those of Raymond James. The information contained in this report does not purport to be a complete description of the securities, markets, or developments referred to in this material. There is no assurance any of the trends mentioned will continue or forecasts will occur. The information has been obtained from sources considered to be reliable, but Raymond James does not guarantee that the foregoing material is accurate or complete. Any information is not a complete summary or statement of all available data necessary for making an investment decision and does not constitute a recommendation. Investing involves risk and you may incur a profit or loss regardless of strategy selected. The S&P 500 is an unmanaged index of 500 widely held stocks that is generally considered representative of the U.S. stock market. The MSCI EAFE (Europe, Australasia, and Far East) is a free float-adjusted market capitalization index that is designed to measure developed market equity performance, excluding the United States & Canada. The EAFE consists of the country indices of 22 developed nations. The Bloomberg Barclays US Aggregate Bond Index is a broad-based flagship benchmark that measures the investment grade, US dollar-denominated, fixed-rate taxable bond market. Keep in mind that individuals cannot invest directly in any index, and index performance does not include transaction costs or other fees, which will affect actual investment performance. Individual investor's results will vary. Past performance does not guarantee future results. Diversification and asset allocation do not ensure a profit or protect against a loss. Investing involves risk and you may incur a profit or loss regardless of strategy selected. Past performance is not a guarantee or a predictor of future results. Raymond James and its advisors do not offer tax or legal advice. You should discuss any tax or legal matters with the appropriate professional.

Q2 2023 Investment Commentary

Print Friendly and PDF

While Federal Reserve (the Fed) policy, macroeconomic headlines such as inflation, and geopolitical uncertainty are themes investors continue to hear about, U.S. large cap stocks finished the first half of 2023 up 15.5%. It is important to look under the hood of these returns as they have been entirely driven by the market's largest stocks, with the top 10 companies in the S&P 500 accounting for over 95% of gains. Beyond the largest companies, performance fell off quickly. Developed markets equity (International) has had notable returns year to date ending over 11% in positive territory for the year so far. While their returns struggled to eclipse the top 10 companies in the S&P 500, international investments handily outpaced the balance of the companies in the S&P 500. Commodities struggled the most as economies and production started to slow, and inflation is coming down (even though it is still elevated higher than we would like to see).


Much of the quarter was dominated by the banking sector headlines that cropped up at the end of the first quarter and debt ceiling negotiations in Washington. Two larger regional bank failures put the markets on edge, waiting for contagion to kick off this quarter. However, the backstop provided by the government and FDIC quickly seemed to curb potential contagion. Then all attention turned toward Washington dragging its feet over raising the debt ceiling, which led to intra-quarter volatility. As the U.S. government approached the date it was expected to run out of money to pay its bills, a deal was reached on June 1st to suspend the debt ceiling through January 2025 while cutting federal spending. As we mentioned in our previous commentary, this is the outcome that would likely occur as history has served as a guide for this. This agreement averted a U.S. government default ahead of the deadline.

The strong equity returns in the year's first half may have taken many by surprise. The question is, where do we go from here? Summer tends to be a time of weakness for markets, and a strong first half of the year could cause buyers to pause. It's not uncommon to see the market stop and gather itself and digest strong gains after they occur.

Higher interest rates

We have witnessed a large amount of excitement surrounding higher interest rates in CDs, money markets, and short-term treasuries. While this is great for money, we need to keep liquid for a shorter-term need or a place to park cash while implementing a dollar-cost averaging strategy; it is important to not give up on investing in a diversified portfolio. When rates were attractive in the early 2000s, it may have been tempting to divert some of your equity investments into cash equivalents rather than invest in the S&P 500 during a recession and continue with this throughout the years. But the opportunity cost is high. The chart below shows how investing $12,000 per year into equities, whether perfectly timed or the most poorly timed, outweighs diverting excess additions beyond need into cash equivalents. Even the worst timing over the years ended up well ahead of cash equivalents.

So, what has happened in the shorter term after times when CD rates peaked and seemed their most attractive? The chart below shows 12-month forward returns for different asset classes after rates peaked. While they may offer the added protection of FDIC insurance, notice that the 6-month CDs never returned more than the peak rate. This makes sense, as you are locking in a rate. The dark blue is the U.S. bond index, the light blue is high-yield bonds, and the green is the S&P 500. As you can see, the other asset classes returned far more than the CD rates 12 months after rates peaked in most of the periods shown below.


Again this reiterates the point not to allocate more than is appropriate for you into short-term fixed strategies.

Check out the video for an economic update!

This summer, all eyes will be on the next Fed decision when the FOMC meets at the end of July. In June, the Fed decided to pause and let the economy digest the drastic rate increases of 2022 and earlier this year. They did signal that we could likely see up to two more rate hikes this summer/fall. The U.S. economy still looks strong, so the FED feels they have room to continue to increase interest rates, even though at a much slower pace to get inflation under control. GDP growth worldwide continues to hold up, signaling we aren't in a recession yet (see the chart below). The Fed will continue to remain very data-dependent when determining their next steps, but the risk is rising that they will overtighten and push the economy into recession.

While the taxable bond yield curve remains strongly inverted, the Municipal bond yield curve is less inverted. This means that investors are better compensated for moving out longer in duration. For those in a higher tax bracket, municipal bonds can provide attractive taxable equivalent yields.

Continue to expect some volatility through the summer as markets digest hefty first-half returns, and we learn more regarding future interest rate action. A sound financial plan and regular rebalancing, when needed, help bring a portfolio through uncertain times. We are here to answer any questions you might have! Do not hesitate to reach out! Thank you for the trust you place in us each and every day!

Angela Palacios, CFP®, AIF®, is a partner and Director of Investments at Center for Financial Planning, Inc.® She chairs The Center Investment Committee and pens a quarterly Investment Commentary.

Any opinions are those of the Angela Palacios, CFP®, AIF® and not necessarily those of Raymond James. The information contained in this report does not purport to be a complete description of the securities, markets, or developments referred to in this material. There is no assurance any of the trends mentioned will continue or forecasts will occur. The information has been obtained from sources considered to be reliable, but Raymond James does not guarantee that the foregoing material is accurate or complete. Any information is not a complete summary or statement of all available data necessary for making an investment decision and does not constitute a recommendation. Investing involves risk and you may incur a profit or loss regardless of strategy selected. The S&P 500 is an unmanaged index of 500 widely held stocks that is generally considered representative of the U.S. stock market. The MSCI EAFE (Europe, Australasia, and Far East) is a free float-adjusted market capitalization index that is designed to measure developed market equity performance, excluding the United States & Canada. The EAFE consists of the country indices of 22 developed nations. The Bloomberg Barclays US Aggregate Bond Index is a broad-based flagship benchmark that measures the investment grade, US dollar-denominated, fixed-rate taxable bond market. Keep in mind that individuals cannot invest directly in any index, and index performance does not include transaction costs or other fees, which will affect actual investment performance. Individual investor's results will vary. Past performance does not guarantee future results. Diversification and asset allocation do not ensure a profit or protect against a loss. Investing involves risk and you may incur a profit or loss regardless of strategy selected. Past performance is not a guarantee or a predictor of future results. Raymond James and its advisors do not offer tax or legal advice. You should discuss any tax or legal matters with the appropriate professional.

Today’s Winners May Have Been Yesterday’s Losers

Print Friendly and PDF

The markets can be described as cyclical, volatile, and full of booms and busts. Often those cycles seem clear as day when looking back on them through history, but they are much harder to identify in real-time. And even when most investors seem to be on the same page about what point of its cycle an investment is in, there is no telling just how far that investment can continue to climb or fall before it turns around. If many investors agree that Nvidia is in a “bubble” at ~35x price to sales, but its stock price climbs another 100%...were they right?

That cyclical nature creates an unpredictable stream of winners and losers every year, but it is important to recognize that it is just that…unpredictable. Today’s winning investments very likely could have been yesterday’s losers. Here are a few recent examples:

  • Energy was the worst-performing sector in 2020 (down over 30% while the market was generally positive). Then from 2021 through 2022, it ran up an incredible 150% (the next closest was healthcare at +23%)

  • The financial sector was the worst performer in 2011 but the best performer in 2012.

  • Real estate was the worst sector in 2013 but the best in 2014.

This trend has been common throughout history. Does that mean we just cracked the code? Just buy the worst-performing sector from the prior year and profit! Well, that doesn’t always work out either:

  • Energy was the worst-performing sector in 2019 and also the worst-performing sector in 2020.

  • Communications was one of the worst in 2013 and again in 2014.

  • Financials were the worst in 2007, and again in 2008.

The uncomfortable fact about the markets is that they are unpredictable, risky, and do not always seem to make sense at the moment, but with that risk comes reward. Trying to time market cycles is a losing game. We believe in creating an approach that positions our clients for success through every boom and bust in their lifetime. No one knows WHEN those booms or busts are coming, but we do know that they will happen sooner or later, and we want you to be prepared either way.

Nicholas Boguth, CFA®, CFP® is a Portfolio Manager at Center for Financial Planning, Inc.® He performs investment research and assists with the management of client portfolios.

The information contained in this letter does not purport to be a complete description of the securities, markets, or developments referred to in this material. The information has been obtained from sources considered to be reliable, but we do not guarantee that the foregoing material is accurate or complete. Any opinions are those of Nick Boguth, CFA®, CFP®, and not necessarily those of Raymond James. Expression of opinion are as of this date and are subject to change without notice. There is no guarantee that these statement, opinions or forecasts provided herein will prove to be correct. Investing involves risk and you may incur a profit or loss regardless of strategy selected, including diversification and asset allocation. Individual investor’s results will vary. Past performance does not guarantee future results. Any information is not a complete summary or statement of all available data necessary for making an investment decision and does not constitute a recommendation.

Securities offered through Raymond James Financial Services, Inc., member FINRA/SIPC. Investment advisory services offered through Center for Financial Planning, Inc.® Center for Financial Planning, Inc.® is not a registered broker/dealer and is independent of Raymond James Financial Services.

Q1 2023 Investment Commentary

Print Friendly and PDF

The year has started much stronger than it may have felt so far. Growth-style investments trounced value-style investments as tech names came back into favor. International development beat U.S. while EM equity lagged, which was contributed by a weaker U.S. dollar. Small company stocks lagged large company stocks mainly due to a heavier technology exposure for large company indexes like the S&P 500. In contrast, the smaller company indexes had a heavier weighting in financials. The Morningstar asset allocation category of funds had 50-70% stock and 30-50% bonds, so on average, a 60% stock/40% bond allocation was up about 3.9% in the first quarter of the year.

Speaking of financials, Silicon Valley Bank (SVB), a lender to some technology companies and startups, became the largest bank to fail since 2008. Signature Bank became the 3rd largest bank to fail within hours of the SVB failure.  

How did they get to the point of failure? SVB was a commercial bank that specialized in servicing the venture capital community. Over the last few years, there has been much activity in venture capital fundraising, and many deposits flowed into the bank in late 2020 and 2021. SVB's balance sheet at this time went from $70 Billion to $200 Billion, while lending was only a fraction of what they did. So they had excess levels of liquidity and took most of that money to purchase treasuries. Their intention was to hold to maturity, so while they didn't have credit risk exposure, they had a lot of interest rate risk. During 2022 they experienced deposit outflows as venture capital companies were experiencing a lot of spending outflows and not as many inflows. At the same time, interest rates increased, causing unrealized losses in these bonds. As money continued to flow out of the bank, this caused a liquidity issue which forced the bank to sell treasuries at a loss to meet withdrawal demands. So ultimately, high amounts of interest rate risk and sector concentration were the main reasons for failure.

What about contagion? It's important to remember that banks do fail almost every year. Usually, they are caused by Fraud or mismanagement. But there are times when something bigger is going on that can cause multiple banks to fail. In the chart below you can see the largest amount of failures happened in the 1980s due to the farm crisis, oil prices, and the S&L crisis. The great recession was another big wave of bank failures.

In the case of the most recent failures, the government acted quickly over the weekend to create policies to back-stop banks that may need to sell treasuries to meet customer withdrawals. These policies allow banks to take cheap loans backed by those treasuries for a short term to meet depositor withdrawal demand if needed without booking losses.

Are my deposits with you covered by FDIC? We diligently review FDIC coverages for our clients. If you're unfamiliar with the Raymond James Bank Deposit program, here is a primer. One account at Raymond James through the Raymond James Bank Deposit Program (RJBDP) can provide up to $3,000,000 ($6,000,000 for joint accounts) of total FDIC coverage. Raymond James does the work behind the scenes as available cash is deposited into interest-bearing deposit accounts. RJ uses a waterfall process to ensure higher cash levels for clients than the traditional limits. With the Raymond James Bank Deposit Program, uninvested cash is deposited into interest-bearing deposit accounts at up to 20 banks, providing this increased FDIC eligibility.

Raymond James will deposit up to $245,000 ($490,000 for joint accounts of two or more) in each bank on a predetermined list. Another way to qualify for more coverage is by holding deposits in different ownership categories (account types such as an individual account, a trust account, and an IRA all qualify for their own FDIC coverage).

Is my money safe in Raymond James Bank? Questions about how Raymond James is positioned in this stressed environment? Watch this video.

Cash management is a much more active process than in the past. Short-term treasuries, Certificate of Deposits, and money market mutual funds offer attractive rates for the right investor. While these options don't carry FDIC coverage, they shouldn't be ignored. Talk to your advisor to explore what might be right for you if you're carrying large cash balances at your bank with no immediate need of utilizing the cash.

The U.S. government is close to its limit (Debt ceiling), where it can no longer borrow additional funds. Several months ago, Congress had to begin using "extraordinary measures" to fulfill some obligations, and the clock is ticking for them to be able to come to an agreement and raise the debt ceiling so that spending can continue without pause. Estimates show these measures run out as early as June. The issue is typical (see other times when the debt limit was raised in the graphic below), but a divided Congress can make the issue more contentious. The main holdup is that Republican opponents want to see spending cuts before the ceiling is raised, and spending cuts are not easy for anyone to agree upon. 

Expect volatility as deadlines to meet obligations approach and the market's price is in more uncertainty. The direct impact and potentially biggest worry for investors is the risk of the U.S. government defaulting on its Treasury debt. Additional pain in the form of spending cuts would have a direct economic impact, with uncertain outcomes and hard decisions being made on where to cut the spending. There is no way to predict the future, but history as a guide would suggest a deal is reached and the ceiling is once again raised as it has been every other time the issue has come up in our lifetimes. We lean on diversification, conservative portfolio positioning, and a sound financial plan during times of uncertainty, and we're always here to answer any questions you might have on the topic.

Is ESG Investing Political? Check out our upcoming webinar on April 19th!

Angela Palacios, CFP®, AIF®, is a partner and Director of Investments at Center for Financial Planning, Inc.® She chairs The Center Investment Committee and pens a quarterly Investment Commentary.

Any opinions are those of the Angela Palacios, CFP®, AIF® and not necessarily those of Raymond James. The information contained in this report does not purport to be a complete description of the securities, markets, or developments referred to in this material. There is no assurance any of the trends mentioned will continue or forecasts will occur. The information has been obtained from sources considered to be reliable, but Raymond James does not guarantee that the foregoing material is accurate or complete. Any information is not a complete summary or statement of all available data necessary for making an investment decision and does not constitute a recommendation. Investing involves risk and you may incur a profit or loss regardless of strategy selected. The S&P 500 is an unmanaged index of 500 widely held stocks that is generally considered representative of the U.S. stock market. Keep in mind that individuals cannot invest directly in any index, and index performance does not include transaction costs or other fees, which will affect actual investment performance. Individual investor's results will vary. Past performance does not guarantee future results. Diversification and asset allocation do not ensure a profit or protect against a loss. Investing involves risk and you may incur a profit or loss regardless of strategy selected. Past performance is not a guarantee or a predictor of future results.

What Goldman Sachs Thinks About Markets: Conference Key Takeaways

Jaclyn Jackson Contributed by: Jaclyn Jackson, CAP®

Print Friendly and PDF

Due diligence meetings are a core part of the Center’s investment research strategy.  They give us a chance to vet investment strategies for our clients. They also allow us to get data from global financial institutions and industry leaders that most advisors typically don’t have the resources to aggregate themselves. 

This fall, I attended the Professional Investor Forum at the Goldman Sachs Conference Center in New York. The three-day conference highlighted research from the company’s thought leaders about markets and the current economic landscape. 

Here are Goldman’s views on a few questions that have been top of mind for investors.

Q: Are we facing another “Great Recession”?

Investor anxiety is reminiscent of the Great Recession, but the root of market volatility is quite different. Market volatility in 2007-2008 was triggered by unhealthy company fundamentals, particularly in the financial sector. The volatility was micro-driven.

Current market volatility is macro-driven with inflation and fed policy expectations largely dictating the investor experience. Since company fundamentals are relatively healthy, Goldman believes a recession would be shallow – especially compared to the Great Recession.

Q:  What’s going on with equity markets?

Rates and higher bond yields have affected the US equity market. Today, the market trades at around 15 times forward earnings compared to 21 times forward earnings at the beginning of the year. A lot of this compression is coming from high growth companies, particularly “long-duration” tech companies where the valuation of the company is attributable to the earnings that are well into the future. 

The gap between shorter-duration stocks and longer-duration stocks has been very significant in terms of the relative performance. This is a tough environment for long-duration stocks because rates will likely stay high. Companies with more nearer-term visibility on their cash flows are likely to do better in this environment. (There are tech companies with more near-term visibility, so no need to dump all tech from your portfolio.)

Inflation clarity is important because that helps us understand the direction of Federal Reserve policy and interest rate policy. Greater investor confidence about corporate earnings might be the impetus for equity volatility to decline - freeing equity prices to move higher.

Equity markets are figured out when inflation is figured out.

Q: How low can equity markets go?

Goldman Sachs expects the inflation rate to lower and for markets to recover in late 2023. This is how they see the timeline unfolding:

  • The Fed will be raising rates several more times this year and early part of 2023.

  • At the end of the year, the S&P 500 will likely close somewhere between 3,400 and 3,600, modestly down from the current level.

  • Markets will be down in the early part of next year until we see inflation data trending lower.

  • Equity market moves higher by the end of 2023.

Note, there is a case to be made for a recession. In a recessionary scenario (where the Fed hikes so much that we move into recessionary territory), Goldman believes we could hit a low of around 3,150, which is meaningfully below where we are now.

Q: When will market volatility lighten up?

Goldman Sachs Economics expects the rate of inflation (as measured by core PCE) to decelerate from close to 5 percent to roughly 3 percent. If that actually happens, they believe equity prices will do okay. Nevertheless, that won’t be clear until sometime in the middle of 2023, so uncertainty will probably continue another six months.

Q:  Where should I be invested?

According to Goldman, we’ve move from a “there is no alternative” or TINA environment to a “there are reasonable alternatives” or TARA environment.

If investors wanted yield they would invest in equities, especially US equities. However, chasing yield through equities leaves the door open to greater risk vulnerability. With interest rates on short-term cash positions starting to approach 4 percent, investors can get an attractive rate of return from an income point of view. In the words of David Kostin, Goldman’s Chief US Equity Strategist, “the idea of pure cash returns pushing almost 4 percent and the expectation that the Fed Funds rate will be somewhere between 4.25 and 4.5 percent by the early part of next year, that would suggest that there are reasonable alternatives (to equities), just on the cash positions alone.”

To be clear, this does NOT mean one should sell all of their equities and buy short-term cash positions. Equity positions in your portfolio should generally align with your strategic allocation. This is suggesting that investors don’t have to take unwarranted risks with over-exposure to equity markets to get yield because there are reasonable alternatives (TARA). Short-term cash positions are one example of this. The key here is that now, investors don’t have to over-do-it with risks when looking for yields.

Fed tightening is a big focus, but other parts of financial conditions are tightening too - higher bond yields, wider credit spreads, stronger dollar, lower equity prices. All of these contribute to tightening financial conditions. The type of companies in the equity market that do well in this environment are companies with stronger balance sheets, companies with higher return metrics, return on equity, return on capital, companies with less drawdown in terms of their share prices, more stable growth in terms of different metrics. In short, “quality” companies are likely to help investors in the uncertain environment of tightening financial conditions.

Jaclyn Jackson, CAP® is a Senior Portfolio Manager at Center for Financial Planning, Inc.® She manages client portfolios and performs investment research.

The foregoing information has been obtained from sources considered to be reliable, but we do not guarantee that it is accurate or complete, it is not a statement of all available data necessary for making an investment decision, and it does not constitute a recommendation. Any opinions are those of the author, and not necessarily those of Raymond James. Investing involves risk and you may incur a profit or loss regardless of strategy selected, including diversification and asset allocation. Keep in mind that individuals cannot invest directly in any index, and index performance does not include transaction costs or other fees, which will affect actual investment performance. Individual investor's results will vary. The S&P 500 is an unmanaged index of 500 widely held stocks that is generally considered representative of the U.S. stock market. Standard deviation measures the fluctuation of returns around the arithmetic average return of investment. The higher the standard deviation, the greater the variability (and thus risk) of the investment returns. Performance of hypothetical investments do not reflect transaction costs, taxes, or returns that any investor actually attained and may not reflect the true costs, including management fees, of an actual portfolio. Changes in any assumption may have a material impact on the hypothetical returns presented. Illustrations does not include fees and expenses, which would reduce returns.

Part 2: Are International Equities Dead?

Nicholas Boguth Contributed by: Nicholas Boguth, CFA®

Print Friendly and PDF

In part 1 of this 2-part blog series, we discussed the importance of diversified investing despite the recent pain that many asset allocations have felt. We're now turning our attention to a key asset class when thinking about diversification…international stocks.

The S&P 500 (U.S. Large Stocks) returned over 14% annualized for the past ten years. The MSCI EAFE (International Large Stocks) returned a "mere" 7% annualized over the same period. 

This run of outperformance from U.S. stocks has been nothing short of astounding. Between the past outperformance and the current geopolitical conflict overseas, you might feel pressure to throw in the towel on international stocks and invest all of your money in the U.S. stock market. Still, we're here to share some perspectives on why that may not be to your benefit. 

My colleague, Jaclyn Jackson, CAP®, Senior Portfolio Manager and Investment Representative, RJFS, shared some research and statistics on the benefits of diversification in a total portfolio. Spreading bets across many asset classes has historically provided a smoother ride for investors and ultimately led to a higher expected value for portfolios.  

The same principle applies within asset classes. History has repeatedly shown that owning many types of stocks, rather than concentrating on one type of stock, may help maximize investors' chances of achieving return goals and limits the chances of major financial loss.

Beyond the timeless lesson from diversification, international stocks are trading at a larger discount to U.S. stocks than we've seen in a long time. History has also shown us that neither asset class has held a permanent premium when comparing U.S. to international. Lower valuations now suggest higher returns in the future, so valuation is a compelling story if you're looking for a reason to stick to your international allocation. 

Chasing performance is a significant pitfall of both novice and professional investors, but rarely leads to improved investment outcomes. The recent, prolonged outperformance of the U.S. stock market may make it tempting to think that the U.S. will continue to outperform indefinitely, but history suggests otherwise. We don't believe international equities are dead, and we'll continue to stick to the timeless practice of diversification in our portfolios.

Nicholas Boguth, CFA® is a Portfolio Manager at Center for Financial Planning, Inc.® He performs investment research and assists with the management of client portfolios.

The foregoing information has been obtained from sources considered to be reliable, but we do not guarantee that it is accurate or complete, it is not a statement of all available data necessary for making an investment decision, and it does not constitute a recommendation. Any opinions are those of Nick Boguth, CFA® and not necessarily those of Raymond James. Investing involves risk and you may incur a profit or loss regardless of strategy selected, including diversification and asset allocation. Keep in mind that individuals cannot invest directly in any index, and index performance does not include transaction costs or other fees, which will affect actual investment performance. Individual investor's results will vary.

The S&P 500 is an unmanaged index of 500 widely held stocks that is generally considered representative of the U.S. stock market. Standard deviation measures the fluctuation of returns around the arithmetic average return of investment. The higher the standard deviation, the greater the variability (and thus risk) of the investment returns.

The MSCI is an index of stocks compiled by Morgan Stanley Capital International. The index consists of more than 1,000 companies in 22 developed markets.

The MSCI EAFE (Europe, Australasia, and Far East) is a free float-adjusted market capitalization index that is designed to measure developed market equity performance, excluding the United States & Canada. The EAFE consists of the country indices of 22 developed nations.

Part 1: Are International Equities Dead?

Jaclyn Jackson Contributed by: Jaclyn Jackson, CAP®

Print Friendly and PDF

This is part one of a two-part blog series. We'll talk about diversification generally in this blog, then zoom in on international equity diversification during the second part of the series.

Amid geopolitical tension and pandemic backlash, equities have taken a beating; bond prices have fallen as the Fed raises rates, and even cash under the mattress is no match for inflation. Looking at our current market environment, I am reminded of the Motown classic sung by Martha and The Vandellas, "Nowhere to Run." For decades, investment professionals have preached the merits of asset allocation and portfolio diversification, but what do you do when it all stinks?

The answer is simple (but the action is hard): Stay the Course! That advice doesn't feel helpful during market turbulence, but honestly, it's the best advice for long-term investors. Let me explain…

Why Diversification Works

Craig L. Israelsen, Ph.D. and Executive-in-Residence in the Personal Financial Planning Program at Utah Valley, did compelling research around portfolio diversification worth reviewing. He compared five portfolios representing different risk levels and asset allocations over 50-years, from 1970 to 2019. While there is much to glean from his research, let's focus on his comparison of two moderately aggressive portfolios (as they most closely resemble the average investor experience):  

  • Traditional “Balanced” Fund: 60% US stock, 40% bond asset allocation

  • Seven Asset Diversified Portfolio: 14.3% allocation to seven different asset classes (asset classes included large U.S. stock, small-cap U.S. stock, non-U.S. developed stock, real estate, commodities, U.S. bonds, and cash)

In 2019, a year dominated by the S&P 500, the Traditional "Balanced" Fund (having a larger composition of the S&P 500) predictably outperformed Seven Asset Diversified Portfolio. On the other hand, over the 50-year period, the latter had a similar annualized gross return with a lower standard deviation. An investor with a diversified portfolio experienced comparable returns without taking as much risk.

Grounding his research in numbers, Israelsen evaluated a $250,000 initial investment for each portfolio over 26 rolling 25-year periods from 1970 to 2019 and assumed a 5% initial end-of-year withdrawal with a 3% annual cost of living adjustment taken at the end of each year. The Traditional "Balanced" Fund had a median ending balance of $1,234,749 after 25 years compared to the Seven Asset Diversified Portfolio median ending balance of $1,806,565.  

The research illustrates why planners have a high conviction in diversification. The Seven Asset Diversified Portfolio provided risk mitigation (as measured by standard deviation) and supported robust returns even with annual withdrawals.

Stay Tuned

We've discussed the merits of diversification in a general sense. In part two of the series, we'll speak more directly about international equities and explain why we believe it is still a diversifier worth holding.

Jaclyn Jackson, CAP® is a Senior Portfolio Manager at Center for Financial Planning, Inc.® She manages client portfolios and performs investment research.

The foregoing information has been obtained from sources considered to be reliable, but we do not guarantee that it is accurate or complete, it is not a statement of all available data necessary for making an investment decision, and it does not constitute a recommendation. Any opinions are those of Jaclyn Jackson, CAP®, and not necessarily those of Raymond James. Investing involves risk and you may incur a profit or loss regardless of strategy selected, including diversification and asset allocation. Keep in mind that individuals cannot invest directly in any index, and index performance does not include transaction costs or other fees, which will affect actual investment performance. Individual investor's results will vary.

The S&P 500 is an unmanaged index of 500 widely held stocks that is generally considered representative of the U.S. stock market. Standard deviation measures the fluctuation of returns around the arithmetic average return of investment. The higher the standard deviation, the greater the variability (and thus risk) of the investment returns.

Focusing on What You Can Control

Josh Bitel Contributed by: Josh Bitel, CFP®

Print Friendly and PDF

May is Mental Health Awareness Month, and as we all know, managing stress can go a long way in improving mental health. Personally, I have always been a bit of a “worry wart” and often have to remind myself not to sweat the small stuff and focus on what I can control. And of course, as a financial planner, I find this very easy to relate to investing and saving for retirement! Below is a graphic from J.P. Morgan that I have shared many times with clients. Just as we try to do in our personal lives, managing what we can control and not worrying about other factors can go a long way in relieving some of the stress that comes with saving for retirement.  

The major area that we as investors often become fixated on (and rightfully so!) is market returns. Ironically, as the chart shows, this is an area we have no control over. The same goes for policies surrounding taxation, savings, and benefits. As you can see, employment and longevity are things we do have some control over by investing in our own human capital and our health. In my opinion, the areas that we have total control over—saving vs. spending and asset allocation and location—are what we need to focus on. We try to have clients focus on consistent and prudent saving, living within (or ideally, below) their means, and maintaining a proper mix of stocks and bonds within their portfolio. Over the course of 35+ years of helping clients achieve their financial goals, The Center has realized that those two areas are the largest contributors to a successful financial plan. 

With so many uncertainties in the world we live in that can impact the market, it is always a timely reminder to focus on the areas we have control over and make sure we get those right. If we do, the other things that we might be stressing over will potentially fall into place. If you need help focusing on the areas of your financial well-being that you CAN control, give us a call! We are always happy to help.

Josh Bitel, CFP® is a CERTIFIED FINANCIAL PLANNER™ professional at Center for Financial Planning, Inc.® He conducts financial planning analysis for clients and has a special interest in retirement income analysis.

The foregoing information has been obtained from sources considered to be reliable, but we do not guarantee that it is accurate or complete, it is not a statement of all available data necessary for making an investment decision, and it does not constitute a recommendation. Any opinions are those of Josh Bitel, CFP® and not necessarily those of Raymond James.