

 Contributed by: Nicholas Boguth, CFA®

Our Director of Investments, Angela Palacios, recently wrote about the factors influencing current inflation rates. She shared a helpful chart from JPMorgan and summarized, “you may be surprised to see the strong average performance from varying asset classes in this scenario. Inflation that is reasonable and expected can be a very positive scenario for many asset classes.”
As the debate continues over whether or not inflation is “transitory,” some investors are thinking about how to protect their portfolios from rising inflation.
Most bonds, aside from TIPS, are generally expected to perform poorly if inflation rises. This should make sense as the fixed income stream from a bond investment will deteriorate if inflation rises. To protect against inflation, one might conclude that removing bonds from a portfolio makes sense, but not so fast. Bonds are typically in a diversified portfolio to protect from the more common (and devastating) risk – a stock market decline. Be sure to know how your portfolio’s risk exposure would shift before considering a move away from bonds.
Vanguard recently released some research on the topic of inflation hedging and concluded that commodities were the best asset class to protect from unexpected inflation. While commodities are generally accepted to be pretty good inflation hedges, one major risk of owning them has been on display for the past ten years. Their return stream can look significantly different than stocks’. Admittedly, this has been one of the best decades in history for U.S. stocks and one of the worst for commodities. To demonstrate just how “different” the returns can be, if you would’ve held one of the largest commodity ETFs over the past ten years, you would’ve underperformed the U.S. stock market by almost 400%.

Trailing 10-year performance of two ETFs that represent the U.S. stock market and the broad commodities market. SPY (green line) tracks the S&P 500, and DBC (blue line) tracks a basket of 14 commodities. Total return. Source: koyfin.com.
Some portfolio managers like Ray Dalio or First Eagle portfolio managers, Matthew McLennan and Kimball Brooker, have been long time proponents of gold as a hedge against inflation. Gold can be a powerful diversifier in a portfolio, but has also seen sustained periods of underperformance that may make it hard to hold over the long term. Here’s a similar chart of how a popular Gold ETF has performed over the past ten years compared to the red hot S&P 500.
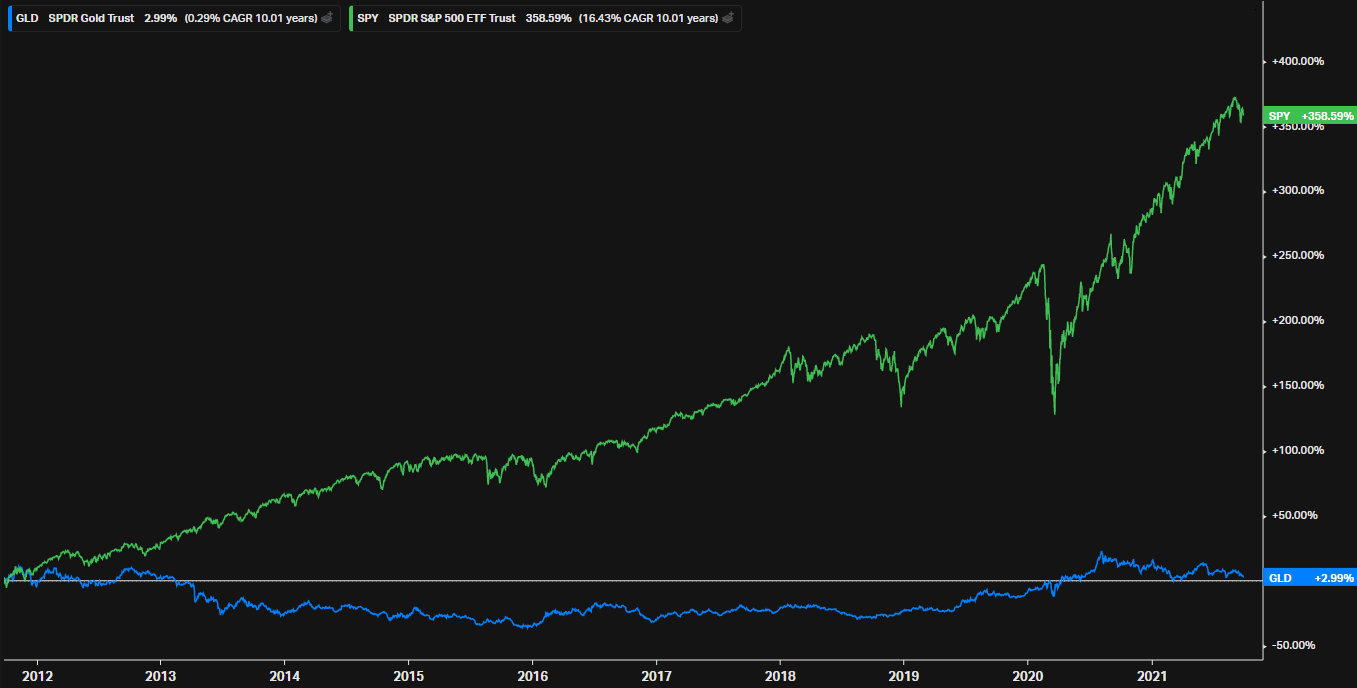
Trailing 10-year performance of two ETFs that represent the U.S. stock market and the price of Gold. SPY (green line) tracks the S&P 500, and GLD (blue line) tracks the gold spot price. Total return. Source: koyfin.com.
You may even see articles claiming that bitcoin is the best inflation hedge to add to your portfolio. These opinion pieces make some compelling arguments, but it is important to remember that they are just opinion pieces; emphasis on opinion. We haven’t truly had an inflationary period since bitcoin became popular in the past decade, so there is no way of knowing if its performance has any correlation to U.S. inflation.
Above all else, before jumping to action on your portfolio, remember that inflation is quite hard to forecast. There are an infinite amount of moving parts and multiple ways to measure them. Professional forecasters don’t even agree on what it will look like in the next 12 months, let alone the next ten years or the remainder of your investment time horizon. One of the best ways to hedge against inflation is to talk to your financial advisor and understand how rising inflation might affect your financial plan. That is why we’re here.
Want to know what The Center thinks about inflation? Check out these resources: Inflation and Stock Returns and How Do I Prepare my Portfolio for Inflation.
Nicholas Boguth, CFA® is a Portfolio Administrator at Center for Financial Planning, Inc.® He performs investment research and assists with the management of client portfolios.
Opinions expressed are not necessarily those of Raymond James. The information has been obtained from sources considered to be reliable, but we do not guarantee that the foregoing material is accurate or complete. Past performance is not a guarantee of future results. Investing involves risk and investors may incur a profit or a loss. Treasury Inflation Protection Securities, or TIPS, adjust the invested principal base by the CPI-U at a semiannual rate. Rate of inflation is based on the CPI-U, which has a three-month lag. Bond prices and yields are subject to change based upon market conditions and availability. If bonds are sold prior to maturity, you may receive more or less than your initial investment. There is an inverse relationship between interest rate movements and fixed income prices. Generally, when interest rates rise, fixed income prices fall and when interest rates fall, fixed income prices rise. Investing in commodities is generally considered speculative because of the significant potential for investment loss. Their markets are likely to be volatile and there may be sharp price fluctuations even during periods when prices overall are rising. Gold is subject to the special risks associated with investing in precious metals, including but not limited to: price may be subject to wide fluctuation; the market is relatively limited; the sources are concentrated in countries that have the potential for instability; and the market is unregulated. Bitcoin issuers are not registered with the SEC, and the bitcoin marketplace is currently unregulated. Bitcoin and other cryptocurrencies are a very speculative investment and involves a high degree of risk.


 and
and 


