Center Investing

2021 Fourth Quarter Investment Commentary

The Center Contributed by: Center Investment Department

Print Friendly and PDF

As we close the books on 2021 and move into 2022, we took a few minutes to re-read our thoughts as we started the year. There was a sense of hope that the recovery would continue, jobs would recover, and the world would start to normalize. There was also worry over finalizing the election and concerns of tax rate increases. While it has been a bumpy road, the year has ended better than where we began in some very important aspects like job recovery and dodging the bullet of widely higher taxes. We do have a fresh batch of worries but also optimism looking ahead to 2022.

A diversified benchmark portfolio consisting of 60% stocks (split 40/20 between U.S.-S&P 500 and International-MSCI EAFE) and 40% bonds (Bloomberg Barclays U.S. Aggregate Bond Index) is up just over 12.5% for 2021, with the S&P 500 again leading the way at +28.71%, international stocks (MSCI EAFE) at +11.78%, and U.S. Aggregate Bonds at -1.54%. Please keep in mind indices are not available for direct investment. Any investor who attempts to mimic the performance of an index would incur fees and expenses which would reduce returns.

The good news is, for yet another year, the above hypothetical diversified portfolio would be up well over any targets we may have designed with you toward meeting financial planning goals; which should be an investor’s ultimate long term target.

Should we continue to diversify your portfolio?

Investors everywhere have been left wondering, “Why don’t I just own more U.S. stocks if they are producing such stellar returns this year while everything else (bonds or emerging) has produced very ho hum to negative results?” During these times, it is important to open our history books and remember the “lost decade.” 

We are referring to the 10 year time period throughout the 2000’s when the S&P 500 produced a negative total return. This was a very difficult time period starting with the burst of the dot-com bubble and ending with the financial crisis of 2008. Many felt like there was nowhere to hide during this time period. In reality however, those with a widely diversified portfolio had quite the opposite results. Sure a portion of their portfolio was flat to down but many of the other areas of their portfolio performed quite well over this decade, boosting their overall portfolio returns. The chart below illustrates average annual returns from some of the major Morningstar categories from 2000-2009.  The lost decade only applied to one type of investment one could own.

Chart and data courtesy John Hancock® Investments

The Center has a long history, being founded in 1985, so we have the benefit of guiding clients through many types of return environments. Coming into this lost decade, investors were asking us the very same questions we are hearing now, and the chart above shows us how that ended. While we don’t believe we are on the doorstep of another lost decade, we do feel it is not the time to abandon diversification. So, when you open your statements this year, you may see other well-known strategies that are roughly 60% Stock/40% bond up even less at just below 10% for the year. So, be careful before making any drastic changes to your portfolio. Talk to your financial planner first to determine how this might impact your long term goals!

What about Inflation?

People are saving less and spending more. Prior to the pandemic the savings rate, according to the Bureau of Economic Analysis, was roughly 7.5%, spiked up to almost 34% at the start of the pandemic in April 2020, and is now back down to 7.5%. With that large savings round trip, however, cash in bank accounts is still very high. Roughly $3.3 trillion of extra cash has accumulated in bank accounts by Americans (source: Longview Economics). All of this extra cash has served as fuel for inflation. As of the end of November, inflation readings hit a 40 year high of 6.8%. Food and energy were the main drivers of these readings. As stimulus slows, we should see spending (demand) in both of these areas level off and even decline a bit.

The Federal Reserve is now taking active measures to try to combat inflation. If you look at the history of interest rates, we have been very low for a long time. The Federal Reserve under chairs, Yellen and Powell, started to creep them back upwards as we emerged from the financial crisis. Then the pandemic struck and The Fed took them right back down near zero. Now the forecast is to start increasing rates again.

The last time we saw inflation at the levels we are at now was back in the early 1980’s. At that time, interest rates were quite high to try to bring inflation down. Sometimes we get the question of why increasing interest rates help to combat inflation. We love this question because it brings us back to the basics of economics!

Inflation is a result of too much money chasing too few goods. Right now, we have both scenarios of this equation playing out. Too much money (remember the paragraph above where we reference how much money households are holding?) chasing too few goods caused by supply chain disruptions. The basic recipe for inflation is in place. You also compound this by the base of comparison; inflation was next to nothing in 2020, teetering on the verge of deflation because no one was spending money. This is called demand-pull inflation for you economics nerds out there. There is also cost-push inflation happening and wages rising for lower income households. This also increases the price of goods and services (higher costs pushing prices higher).

So if low interest rates (cheap borrowing) and government stimulus has put money into our hands to spend and cause inflation, higher interest rates (more expensive borrowing) and no more government handouts should start to take money out of our hands for spending and therefore slowing the rate we buy things. With less demand comes lower prices or at least prices that rise at a slower pace. This is a long and slow process though. These moves by the Federal Reserve do not accomplish the task overnight. Higher interest rates take months to years to filter their way into the economy and slow inflation. Other forces may be present to help curb inflation in the new year as well. Our basis of comparison is going to rise steadily throughout 2022 and supply chain disruptions should start to ease.

Stocks are expensive.  Is now a bad time to buy?

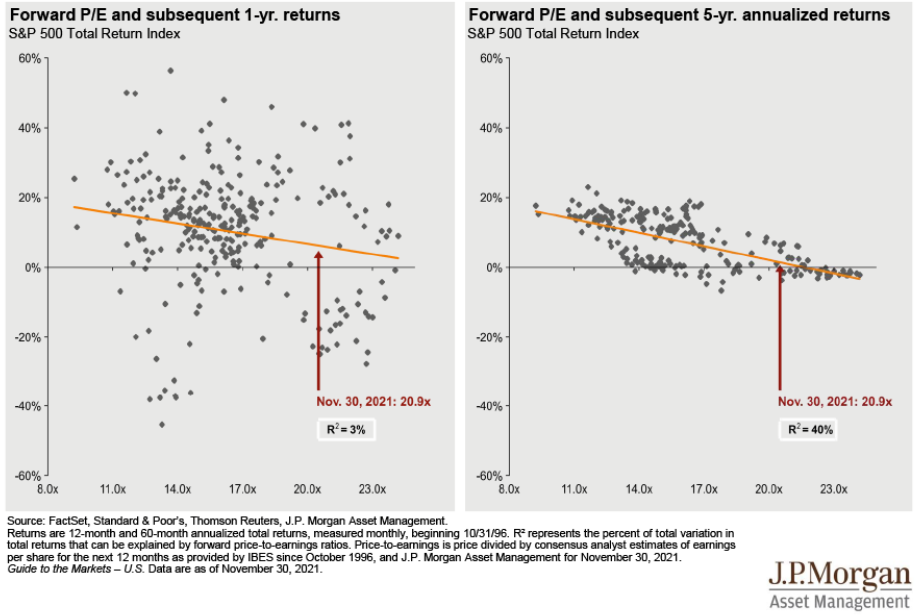
Stocks were expensive at the start of last year too, but if you avoided the S&P 500 last year then you missed out on over 28% of returns. Valuations are not everything when it comes to stock returns, and trying to time the market rarely works in investors’ favor. We are not market timers, but we do monitor the yield curve, leading economic indicators, and various commentary resources for determining our outlook for equities and bonds. Right now, our signals are still saying neutral stocks to bonds. Our research has also found that forward market performance is not correlated highly with P/E ratios.

The below chart shows how uncorrelated valuations are as a short term indicator. Sometimes, with this reading as of November 30th, the market has been up 20-40% (gray dots above the orange line in the left hand chart) one year out and sometimes it has been down 20-30% (gray dots below the orange line in the left hand chart).  Five year forward returns were all positive and in most cases positive by more than 5-6%.
International valuations are the opposite story and have been for a long time too, yet they continue to underperform.  We continue to hold them as part of the allocation because of the compelling valuation story and importance of diversification. This chart is interesting because it shows how long you can be wrong making an investment call purely on valuation. The ACWI ex-US looked like a good deal versus the U.S. 10 years ago and we know how that story has ended.

The final thing we would like you to remember if you find yourself asking “is now a bad time to buy?” is that if your portfolio is diversified, then large U.S. stocks will only make up a portion of your portfolio. In a diversified 60/40 portfolio for instance, S&P 500 stocks might only make up ¼ of your total portfolio. The other asset classes should provide different return streams or even buffer the portfolio in the event of a U.S. stock market decline. Stick to your plan, rebalance according to it, and avoid making all-in or all-out decisions that could impair your financial future.

Looking forward to 2022

We should start to see interest rates increase and, therefore, we are favoring shorter duration bonds in portfolios for now. We want to continue to let your bonds be bonds and your stocks be stocks. Bonds continue to be an important portion of your portfolio to serve as a volatility dampener while we leave our equities free to generate returns needed to achieve your financial planning goals.

The CDC is relaxing quarantine guidelines as more and more information becomes known about transmutability of the virus. This should serve to start relaxing supply chain disruptions caused by virus spikes hopefully alleviating the transitory portion of inflation. Part of the reason the U.S. performed so strongly in 2021 was a continuation of the re-opening story. We resisted further economic shutdowns despite new waves of Covid outbreaks. Overseas was a different story as outbreaks brought continued sporadic shutdowns. As immunities build and the virus continues to (hopefully) evolve into weaker strains, we should see less of this supporting stronger rallies with overseas markets.

If you are interested in hearing more about our forward-looking views, join us in February for our Economic and Investment Outlook Event. Stay tuned for details in the upcoming weeks.

Remember, we are here to help you meet your investment goals, so feel free to reach out to the investment team or your planner anytime for support. On behalf of the entire Center Team, we wish you a wonderful 2022.

Any opinions are those of the author and not necessarily those of Raymond James. The information contained in this report does not purport to be a complete description of the securities, markets, or developments referred to in this material. There is no assurance any of the trends mentioned will continue or forecasts will occur. The information has been obtained from sources considered to be reliable, but Raymond James does not guarantee that the foregoing material is accurate or complete. Any information is not a complete summary or statement of all available data necessary for making an investment decision and does not constitute a recommendation. Investing involves risk and you may incur a profit or loss regardless of strategy selected. The S&P 500 is an unmanaged index of 500 widely held stocks that is generally considered representative of the U.S. stock market. The MSCI EAFE (Europe, Australasia, and Far East) is a free float-adjusted market capitalization index that is designed to measure developed market equity performance, excluding the United States & Canada. The EAFE consists of the country indices of 22 developed nations. The Bloomberg Barclays US Aggregate Bond Index is a broad-based flagship benchmark that measures the investment grade, US dollar-denominated, fixed-rate taxable bond market. Keep in mind that individuals cannot invest directly in any index, and index performance does not include transaction costs or other fees, which will affect actual investment performance. Individual investor's results will vary. Past performance does not guarantee future results. Diversification and asset allocation do not ensure a profit or protect against a loss. Dividends are not guaranteed and must be authorized by the company's board of directors. Special Purpose Acquisition Companies may not be suitable for all investors. Investors should be familiar with the unique characteristics, risks and return potential of SPACs, including the risk that the acquisition may not occur or that the customer's investment may decline in value even if the acquisition is completed. Investing involves risk and you may incur a profit or loss regardless of strategy selected. Past performance is not a guarantee or a predictor of future results. Raymond James and its advisors do not offer tax or legal advice. You should discuss any tax or legal matters with the appropriate professional.

Tips for Managing Restricted Stock Units

Robert Ingram Contributed by: Robert Ingram, CFP®

Print Friendly and PDF

Does your employer offer company stock as part of your compensation package? There are many forms of equity compensation ranging from different types of stock awards to employee stock options (ESO) and employee stock purchase plans (ESPP). Over the last several years, Restricted Stocks Units (RSU) have become one of the most popular alternatives offered by companies. 

 Unlike pure stock awards that grant shares of stock or stock options that provide an employee the right to purchase shares at a predetermined price for a specific period of time, grants of RSUs are not actual shares of stock (yet). An RSU is essentially a promise made by the employer company to deliver to the employee shares of stock or cash payment for the value of stock shares following a vesting schedule. The vesting schedule is often based on a required length of employment, such as a three-year or four-year period, or other company performance goals. The number of units generally corresponds to shares of stock, but the units have no value until the employee receives the corresponding stock shares (or equivalent payment) when they vest.  

 How do RSUs Work? 

Let’s say your employer company grants you 1,000 Restricted Stock Units this year with a grant date of September 1st, and a 4-year vesting schedule under which 25% of the units vest each year as shares of the company’s stock. The following September 1st after the original grant date (one year later) as long as you had continued your employment, the first 25% of your 1,000 RSUs vests as actual company stock shares. Assuming the market value of the stock at the time of vesting is $50 per share, you would have 250 shares of stock worth $12,500. 

 Once the shares have vested and been delivered, you now have ownership rights such as voting rights and rights to dividend payments. You can also choose to hold or to sell the shares from that point. In each subsequent year going forward, the next 25% of your RSUs would vest until the 4th year when the remaining 250 of the 1,000 units vest. 

 One of the first important planning considerations for Restricted Stock Units is their taxation. How are RSUs taxed and how might that impact your tax situation?

 There are three triggering events with RSUs to understand.

 When You Receive RSU Grants

In most cases, at the time you receive your RSU grants, there are no tax implications. Because there is no transfer of actual property by the company until vesting in the form of shares or cash payment, the IRS does not consider the value of the stock represented by RSUs as income compensation when the grant occurs. This means the RSU grants themselves are not taxed.

 When RSUs Vest 

 Once the restricted units vest and the employer delivers the shares of stock or equivalent cash payment, the fair market value of the vested shares or cash payment as of that date (minus any amount the employee had to pay for the RSUs) is considered income and is taxed as ordinary income. Typically, companies grant RSUs without the employee paying a portion, so the full value of the vested shares would be reported as income.  

 In our example above with the 1,000 RSU grants, 250 RSUs vested with the fair market value of $50 per share for a total value of $12,500. This $12,500 would be considered compensation and would be reportable as ordinary income for that tax year. This would apply to the remaining RSUs in the years that they vest. Because this amount is treated as ordinary income, the applicable tax rate under the federal income tax brackets would apply (as well as applicable state income taxes).  

 To cover the tax withholding for this reported income at vesting, most companies allow you a few options. These may include:

  • Having the number of shares withheld to cover the equivalent dollar amount

  • Selling shares to provide the proceeds for the withholding amount

  • Providing a cash payment into the plan to cover the withholding

When You Sell Shares 

 At the time RSUs vest, the market value of those shares is reported as ordinary income. That per-share value then becomes the new cost basis for that group of shares. If you immediately sell the vested shares as of the vesting date, there would be no additional tax. The value of the shares has already been taxed as ordinary income, and the sale price of the shares would equal the cost basis of the shares (no additional gain or loss).

 If however, you choose to hold the shares and sell them in the future, any difference between the sale price and the cost basis would be a capital gain or capital loss depending on whether the sale price was greater than or less than the cost basis.  

 Once again using our example of the 1,000 RSU grants, let’s assume the fair market value of 250 shares at vesting was $50 per share and that you held those shares for over one year. If you then sold the 250 shares for $75 per share, you would have a capital gain of $25 per share ($75 - $50) for a total of $6,250. Since you held the shares for more than one year from the vesting date, this $6,250 would be taxed as a long-term capital gain and subject to the long-term capital gains tax rate of either 0%, 15%, or 20% (as of 2021) depending on your total taxable income. 

 If you were to sell shares within one year of their vesting date, any capital gain would be a short-term capital gain taxed as ordinary income. Since the federal tax brackets apply to ordinary income, you may pay a higher tax rate on the short-term capital gain than you would on a long-term gain even at the highest long-term capital gains rate of 20% (depending on where your income falls within the tax brackets).

 Planning for Additional Income

Because Restricted Stock Units can add to your taxable income (as the units vest and potentially when you sell shares), there are some strategies you may consider to help offset the extra taxable income in those years. For individuals and couples in higher tax brackets, this can be an especially important planning item.  

Some examples could include:

  • Maximizing your pre-tax contributions to your 401k, 403(b), or other retirement accounts. If you or your spouse are not yet contributing to the full annual maximum, this can be a great opportunity. ($19,500 in 2021 plus an extra $6,500 “catch up” for age 50 and above). In some cases, if cash flow is tight, it could even make sense to sell a portion of vested RSUs to replace the income going to the extra contributions.

  • Contributions to a Health Savings Account (HSA) are pre-tax/tax-deductible, so each dollar contributed reduces your taxable income. If you have a qualifying high deductible health plan, consider funding an HSA up to the annual maximum ($3,600 for individuals/$,7,200 for family coverage, plus an extra $1,000 “catch up for age 55 and above)

 Deferred Compensation plans (if available) could be an option. Many executive compensation packages offer types of deferred compensation plans. By participating, you generally defer a portion of your income into a plan with the promise that the plan will pay the balance to you in the future. The amount you defer each year does not count towards your income that year. These funds can grow through different investment options, and you select how and when the balance in the plan pays out to you, based on the individual plan rules. While this can be an effective way to reduce current income and build another savings asset, there are many factors to consider before participating. 

  • Plans can be complex, often less flexible than other savings vehicles, and dependent on the financial strength and commitment of the employer.

  • Harvesting capital losses in a regular, taxable investment account can also be a good tax management strategy. By selling investment holdings that have a loss, those capital losses offset realized capital gains. In addition, if there are any remaining excess losses after offsetting gains, you can then offset up to $3,000 of ordinary income per year. Any excess losses above the $3,000 can be carried over to the following tax year.

 When Should I Sell RSUs?

 The factors in the decision to sell or to hold RSUs that have vested as shares (in addition to tax considerations) should be similar to factors you would consider for other individual stocks or investment securities. A question to ask yourself is whether you would choose to invest your own money in the company stock or some other investment. You should consider the fundamentals of the business. Is it a growing business with good prospects within its industry? Is it in a strong financial position; or is it burdened by excessive debt? Consider the valuation of the company. Is the stock price high or low compared to the company’s earnings and cash flow?

Consider what percentage of your investments and net worth the company stock represents. Having too high a concentration of your wealth in a single security poses the risk of significant loss if the stock price falls. Not only are you taking on overall market risk, but you also have the risk of the single company. While each situation is unique, we generally recommend that your percentage of company stock not exceed 10% of your investment assets.

You should also consider your financial needs both short-term and long-term. 

Do you have cash expenses you need to fund in the next year or two and do you already have resources set aside? 

If you’re counting on proceeds from your RSUs, it could make sense to sell shares and protect the cash needed rather than risk selling shares when the value may be lower.  

 As you can see, equity compensation and specifically RSUs can affect different parts of your financial plan and can involve so many variables. That’s why it’s critical that you work with your financial and tax advisors when making these more complex planning decisions. 

So please don’t hesitate to reach out if we can be a resource.

Robert Ingram, CFP®, is a CERTIFIED FINANCIAL PLANNER™ professional at Center for Financial Planning, Inc.® With more than 15 years of industry experience, he is a trusted source for local media outlets and frequent contributor to The Center’s “Money Centered” blog.

Disclosure: While we are familiar with the tax provisions of the issues presented herein, as Financial Advisors of RJFS, we are not qualified to render advice on tax or legal matters. You should discuss tax or legal matters with the appropriate professional.
2021 Second Quarter Investment Commentary


The Center Contributed by: Center Investment Department

Print Friendly and PDF

Markets and the economy are still riding the high of greater than expected fiscal stimulus at the beginning the year, an easy Federal Reserve, and economic re-opening. Generally speaking, when economies are expected to do well, stock prices will rise and bond yields are pressured upward which pushes current bond prices down. 2021 is following that pattern. Stock markets around the world continue to climb, and bond yields here in the U.S. are rising as well. To put performance in context, we look at a simple diversified portfolio benchmark consisting of 60% stocks (split between U.S.-S&P 500 and International-MSCI EAFE) and 40% bonds (Bloomberg Barclays U.S. Aggregate Bond Index). This benchmark portfolio is up just over 7% year-to-date as of June 30th, with the S&P 500 leading the way at +15.2%, international stocks (MSCI EAFE) at +9%, and U.S. Aggregate Bonds at a quiet -1.6%.

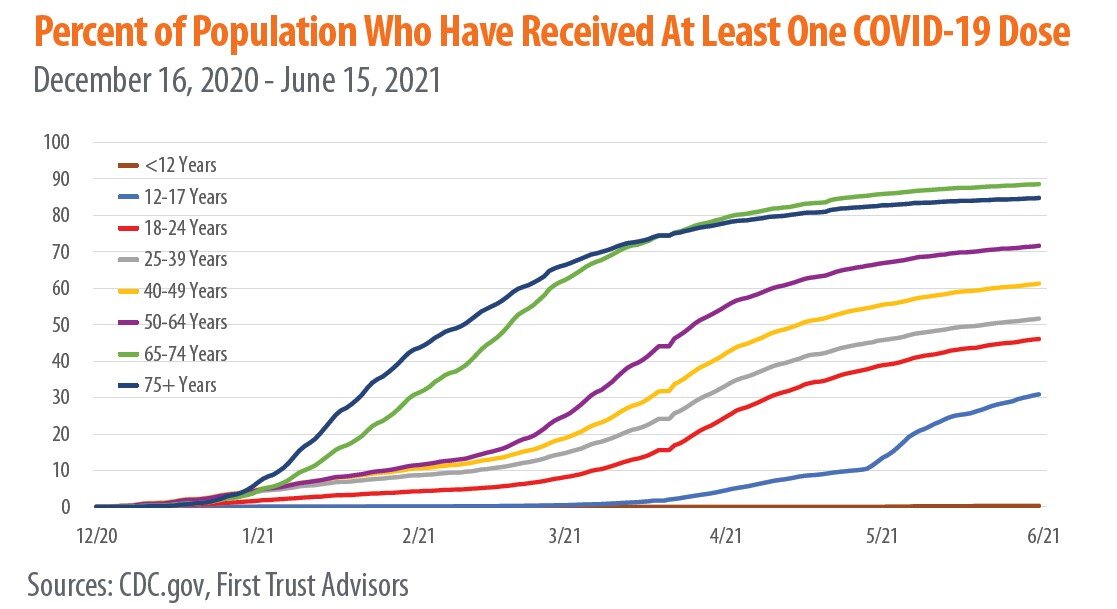
Gross Domestic Product has shown a sharp increase this year as well as inflation readings heating up (see our recent blog for more information).  Many American’s have received at least 1 dose of a COVID vaccine with high vaccination rates among our most vulnerable population 65+.  Over 80% of those individuals have received a vaccination.  Now that the 12 - 16 year old community can receive a vaccination we are only awaiting an approval of a vaccine for younger children.  It is likely we will see something later this year.

Federal Reserve (The Fed) Policy updates

Short term rates were left unchanged as expected and the monthly pace of asset purchases by the Federal Open Market Committee is unchanged.  Market expectations of future interest rate movements rely strongly on the “dot plot” which is a summary of individual projections of year-end target rates for each of the 18 senior Fed officials (even though not all of them get a vote).  Based on this, news headlines are suggesting the Fed is now targeting two rate increase by the end of the 2023.  When asked, Chairman Powell stated, “dots need to be taken with a big grain of salt.”  So it looks like the Fed maintains their outlook of keeping rates low through the end of 2023 but that the bond market may be pricing in rate hikes earlier than this.

Jobs

The Fed also notes labor force participation rates are lagging as evidenced by more job openings then people unemployed. 

Source: Bureau of Labor Statistics

Source: Bureau of Labor Statistics

This is, likely, still driven by pandemic-related issues like caregiver needs, ongoing fear of the virus and supplemental/extended unemployment insurance benefits.  As these abate we should see people returning to the workforce and the bottleneck in unemployment alleviated.  Additional government unemployment benefits were set to expire in 25 states at the end of June and the remainder of states by the end of September.  This should result in individuals returning to the labor force especially in the lower wage jobs.  We will be closely watching this to see if upward wage pressure is alleviated as people resume work.  If not, this could indicate a structural lack of labor participants and be a larger than expected driver of inflation.

Real Estate

The real estate sector benefits from the rising value of assets with rising rates as well as inflation-linked product prices and leases.  From a market standpoint, individual company level investments offer opportunity.  In other words, the sector currently favors stock pickers.  Investors who think inflation will be strong in the coming years target companies with properties that have shorter leases.  While anticipation for government-backed projects in the near future spotlight infrastructure companies.  However, what to buy is not what challenges investors when it comes to this sector.  The true challenge is understanding when to buy this sector.  For that reason, many experts like Michelle Butler, real assets portfolio specialist at Cohen & Steers, recommend having an ongoing real asset portfolio allocation to provide protection against unexpected inflation. 

From a political standpoint, our eyes are poised on Joe Biden’s American Families Plan and the implications it may have on real estate.  According to white house briefings, the American Families plan is “$1.8 trillion in investments and tax credits for American families and children over ten years. It consists of about $1 trillion in investments and $800 billion in tax cuts for American families and workers”.  One of the proposed ways of funding the plan is changing favorable tax treatment on 1031 exchanges. Traditionally, 1031 exchanges (like-kind exchanges) allow investors to defer real estate taxes by rolling profits into their next property purchase.  The new tax proposal seeks to remove tax deferments on property gains over $500,000.  While meant to largely impact the wealthiest of investors, some experts fear the proposal could also have a negative effect on small business owners.  Please note, these are just proposals and not legislation that has been introduced or passed at this point.  We are watching to see how this plays out.

Additional notes on inflation:

If inflation is less transitory and more persistent than expected it is important to understand the areas we think about leaning toward in portfolio construction.  Real Assets, Value stocks and active management within your bond portfolio to take advantage of areas like treasury inflation protection bonds can be very important.  Read all the way to the end of the above linked inflation blog to see what other asset classes might fare well in a low and rising inflationary environment.

Crypto Crash 2021

This isn’t the first time cryptocurrency has lost a majority of its value in a flash crash, and it won’t be the last. In 2012, 2015, and 2019 it fell more than EIGHTY PERCENT from its previous high. At $32,000 Bitcoin is currently about 50% off its previous high. Fun math check – in order to reach an 80% drawdown from its previous high, it would have to fall ANOTHER 60% from here. In an aggressive portfolio actively managed cryptocurrency can generate market crushing returns (or losses) depending on time of purchase and an investors ability to be disciplined in their selling strategy. Look out for a blog in the coming months for more on cryptocurrency trading, speculation, blockchain technology, and threats to the crypto industry.

Here are a few ESG investment focused recent additions to our website to check out:

The Center Social Strategy

ESG Investing: Why Everybody Is Talking About It

Not All ESG Funds Are Created Equal

The Center Social Strategy: How We Construct Values-Based Portfolios

 As always, don’t hesitate to reach out to us if you have any questions or would like to explore any of these topics further!  We appreciate the continued trust you place in us!

Angela Palacios, CFP®, AIF®, is a partner and Director of Investments at Center for Financial Planning, Inc.® She chairs The Center Investment Committee and pens a quarterly Investment Commentary.

Jaclyn Jackson, CAP® is a Portfolio Manager at Center for Financial Planning, Inc.® She manages client portfolios and performs investment research.

Nicholas Boguth is a Portfolio Administrator at Center for Financial Planning, Inc.® He performs investment research and assists with the management of client portfolios.

Opinions expressed are those of the author and are not necessarily those of Raymond James. All opinions are as of his date and are subject to change without notice. Future investment performance cannot be guaranteed, investment yields will fluctuate with market conditions. The S&P 500 is an unmanaged index of 500 widely held stocks that is generally considered representative of the U.S. stock market. The MSCI EAFE (Europe, Ausrtalasia, and Far East) is a free float-adjusted market capitalization index that is designed to measure developed market equity performance, excluding the United States & Canada. The EAFE consists of the country indices of 22 developed nations. The Bloomberg Barclays US Aggregate Bond Index is a broad-based flagship benchmark that measures the investment grade, US dollar-denominated, fixed-rate taxable bond market. Keep in mind that individuals cannot invest directly in any index, and index performances does not include transaction costs or other fees, which will affect actual investment performance. Individual investor’s results will vary. Past performance does not guarantee future results. Bitcoin issuers are not registered with the SEC, and the bitcoin marketplace is currently unregulated. Bitcoin and other cryptocurrencies are a very speculative investment and involves a high degree of risk.

Market Performance and Viral Outbreaks

Print Friendly and PDF
Market+Performance+and+Viral+Outbreaks

Recent market volatility caused by the spread of the coronavirus and a fear of a global economic slowdown has left many wondering if this has happened before and if so, is it different this time?  There have been numerous outbreaks in recent history that we can look at.  Below is a list of different outbreaks (many of which were far deadlier than the coronavirus) that occurred. Check out the return of the S&P 500 6 and 12 months after the epidemic.

But how about a short term global impact?  The chart below shows 1 month, 3 month, and 6 month returns of the MSCI World index.  Again, not the extreme reaction that we are feeling right now in markets. 

While there may have been short term volatility, in most cases it was short lived.

But you may still be thinking that it is different this time.   The world is far more dependent on global trade than it was during SARS in 2003 for example.  There will be some supply chain disruptions and we may not be able to source these goods from other locations quickly enough.  For example, Coca-Cola recently announced that there may be some supply disruptions in the artificial sweetener used in Diet Coke and Zero Sugar Coke…this could be devastating!  I may have to switch to drinking regular coke! Actually, I don’t drink very much pop but now that I know there could be a shortage I’m craving it!  Jokes aside, many industries may face this challenge until China is back up and running around the globe.  The trade war has actually done more to prepare us for this situation than, I think, anything could have.  Companies were already searching for supply sources outside of China or bringing production back into the U.S. after the implementation of tariffs last year.

The severity of the virus will dictate the eventual outcome. Right now investors are taking a “sell first and ask questions later” mentality. We have a lot to learn from the individuals in the U.S. under care of physicians here in the U.S. as to exactly how deadly this flu is under our system of healthcare which is one of the best in the world. Markets are selling off on a guess, right now, of where this could head. If history is any indicator, by this time next year, this should be a distant memory.

Angela Palacios, CFP®, AIF®, is a partner and Director of Investments at Center for Financial Planning, Inc.® She chairs The Center Investment Committee and pens a quarterly Investment Commentary.


There is no guarantee that these statements, opinions or forecasts provided herein will prove to be correct. Past Performance does not guarantee future results. One cannot invest directly in an index. The S&P 500 is an unmanaged index of 500 widely held stocks that is generally considered representative of the U.S. stock market. The MSCI World is a free float-adjusted market capitalization index that is designed to measure large and mid cap performance across 23 developed markets countries. The information has been obtained from sources considered to be reliable, but we do not guarantee that the foregoing material is accurate or complete.

The Single Most Important Investing Decision

Nicholas Boguth Contributed by: Nicholas Boguth

Most Important Investing Decision Center for Financial Planning, Inc.®

Unsurprisingly, I think investing is fun. This is one of the reasons I’ve chosen a career in investment management. With that being said, my career is only 6 years in. Is it possible that I only think investing is fun because the stock market has hit a new all‐time high every single year of my career? Do stocks ever fall? Why even own bonds that pay 2% coupons?

With the decade being over, and the S&P 500 rising almost 190% over the prior ten years, it seems like a good time to remind ourselves of a few key investing principles.

  • Stocks are risky. Their prices can fall.

  • Bonds are boring, but they have potential to help preserve your portfolio.

  • Asset allocation is the single most important investing decision you will make.

Asset allocation in its simplest form is the ratio of stocks to bonds in your portfolio. More stocks in your portfolio means more risk. More bonds in your portfolio means more potential to balance out the risk of stocks. As financial planners, one of the first decisions we’ll help you make is the decision of what asset allocation is most likely going to lead to your financial success.

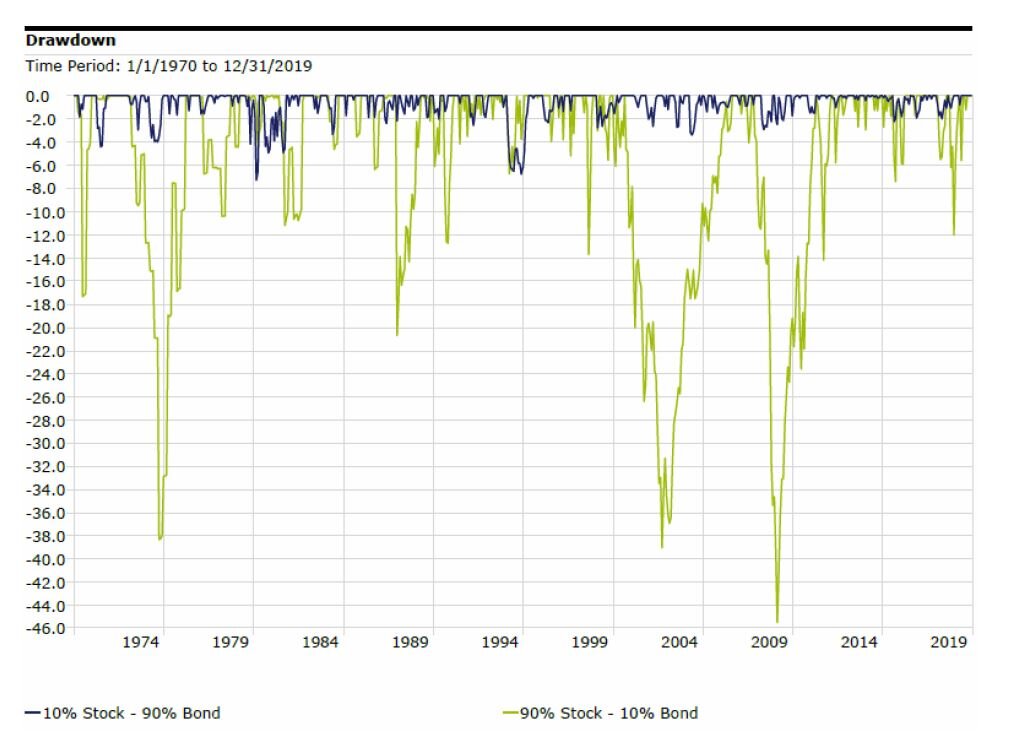
Take a look at the drawdowns of a portfolio of mostly stocks (green line) compared to a portfolio of mostly bonds (blue line). Stocks may have roared through the 2010’s, but no one has a crystal ball to tell us what they will do in the 2020’s. This chart is a good reminder of what stocks CAN do. Be sure that your portfolio is set up to maximize your chance of success no matter what stocks do. If you are unsure about your current portfolio, we’re here to help.

Source: Morningstar Direct. Stock index: S&P 500 TR (monthly). Bond Index: IA SBBI US IT Govt Bond TR (monthly).

Source: Morningstar Direct. Stock index: S&P 500 TR (monthly). Bond Index: IA SBBI US IT Govt Bond TR (monthly).

Nicholas Boguth is a Portfolio Administrator at Center for Financial Planning, Inc.® He performs investment research and assists with the management of client portfolios.


Investing involves risk and you may incur a profit or loss regardless of strategy selected, including diversification and asset allocation.

The information has been obtained from sources considered to be reliable, but we do not guarantee that the foregoing material is accurate or complete. The IA SBBI US IT Government Bond Index is an index created by Ibbotson Associates designed to track the total return of intermediate maturity US Treasury debt securities. One cannot invest directly in an index. Past Performance does not guarantee future results.

Investment Commentary: Fourth Quarter 2019

Center for Financial Planning, Inc.® Investment Commentary Fourth Quarter 2019

It’s a new decade, and there is much to discuss! We’d love to see you at our annual Economic and Investment Outlook event, happening Wednesday, February 5, from 11:30 a.m. to 1 p.m. We’ll review the past year and take a look at what to expect in 2020. Lunch will be provided. You can register here. If you are unable to attend, don’t worry! We’ll send a link to view the presentation afterward.

2019 in Review

Where’s the beef? 2019 will be remembered as the year of the meat alternative. Burger King introduced the “Impossible Whopper”. Fans raved that this meatless alternative tastes great (I’ll take their word for it). However, investors were not left wondering about the beef in the markets, as 2019 saw excellent returns for both bonds and stocks. 2019 was strong until early May, rallying from a 2018 Christmas Eve low over 25%. The old adage “sell in May and go away” would have worked for investors this year. Point-to-point, from early May to early October, the S&P 500 was down just under 2%. From October on, however, the markets rallied strongly through year-end. Here’s how they finished up for the year:

 
Center for Financial Planning, Inc.® Investments 2019 Market Returns
 

What spurred this strong rally?

The Federal Reserve Board (the Fed)

Interest rates were cut three times throughout 2019, with guidance from the Fed that future rate hikes were very unlikely, while inflation remained low. This was a complete turnaround from the Fed, increasing rates four times in 2018 to the point that the yield curve briefly inverted in early 2019. (The yield curve shows what interest bonds of the same credit quality with different maturity dates pay.) This meant that the yield on a 2-year U.S. Treasury bond was paying more interest than a 10-year Treasury bond. Since then, the yield curve has rapidly steepened as short-term interest rates moved back down. Cutting rates not only spurred bonds to a record year, but also provided a tailwind that lifted stock markets to higher levels. Remember the old saying “Don’t fight the Fed”? This means that when the Fed is reducing interest rates, markets tend to go up, and this year was no exception.

Trade wars

Markets have responded very favorably to the trade war de-escalation. China and the U.S agreed to the phase-one trade deal in December, removing significant unpredictability, at least in the near term. This agreement rolls back a portion of the existing tariffs and cancels the tariffs that were to be implemented on December 15, 2019. China also has committed to purchasing more agricultural products, goods, and services from the U.S. in the coming years. However, significant work remains to resolve the larger sticking points in the trade war. This will likely be a factor influencing market performance and volatility in the coming year.

Corporate Buybacks

Over the course of the business cycle, the contribution to equity returns from corporate share buybacks ebbs and flows. Companies frequently buy back their own shares with the firm’s profits. This will increase Earnings Per Share (EPS), because the company’s earnings are divided among fewer shares, and it becomes a way to potentially increase stock prices.

Post-recession, companies tend to have less expendable cash and tend to buy back fewer shares. Later in the business cycle, they become cash rich and are able to more heavily deploy funds. This business cycle is no exception. Share buybacks throughout 2018 and 2019 have been a contributor to growth in EPS for companies. The one time allowance of corporate funds repatriation at a lower tax rate (allowed by Trump’s tax reform) has, no doubt, boosted this a bit.

The chart below shows the growing percentage of share buy backs. Twenty-eight percent of corporate cash on hand was utilized for this in 2018 and 2019, versus only 21% in 2010. Also notable, is the growing pool of cash (total height of the bar each year) for S&P 500 companies.

 
Source: Bloomberg, Compustat, FactSet, Standard & Poor’s, J.P. Morgan Asset Management

Source: Bloomberg, Compustat, FactSet, Standard & Poor’s, J.P. Morgan Asset Management


Impeachment threatened to derail the 2019 stock market rally

The House of Representatives formally voted to Impeach President Trump in December, which the markets largely anticipated. Now, the House is preparing to send the Articles of Impeachment to the Senate and begin trial there. The Republican-controlled Senate is expected to acquit President Trump. If the vote goes as expected, it should not have an impact on markets. I see this as the most likely scenario.

What do we expect for 2020?

Election year

As 2020 ramps up, so will the political campaigns. The chart below looks at the S&P 500 performance during election years. The story is largely one of positive returns. In previous years, 6- and 12-month returns ahead of a presidential election have been positive almost 90% of the time.

Center for Financial Planning, Inc.® Investment Commentary Fourth Quarter 2019

Our economic indicators support moderate growth, and markets are playing out in a positive manner, but we are watching a few points of worry.

U.S.-Iran tensions increase

The markets took a hit during the first week of January, after a move by President Trump. In response to Iran’s latest threat, Trump targeted Iran’s top general Qasem Soleimani, ultimately killing him in a U.S. air strike. This marks a departure from the nonmilitary approach the president has taken with the rest of the world, and caused the markets to quickly pull back. We’ll be watching the escalation of this geopolitical risk. 

After studying markets during other overseas military conflicts, we see the stock market flare up at the beginning of each conflict, when uncertainty is at its greatest. Once a course of action is decided, markets tend to settle into a general growth pattern, if the overall economy remains strong. This holds true even if that action is U.S. military invasion, which may seem counter intuitive. During this tension, many investors chose bonds as their safe haven. Oil is expected to spike and put some upward pressure on inflation. However, the amount of oil we can supply ourselves could mute this impact.

Economic Highlights:

  • Unemployment remains at 50 year lows at 3.5%.

  • Inflation, as measured by the PCE Price Index, rose 1.6% over the year ending November 2019.

  • Gross Domestic Product (GDP) rose 2.1% in the third quarter, exceeding expectations.

  • Retail sales increased 3.3% year over year, with online sales leading the growth – signs of a healthy consumer.

  • U.S. dollar strength continues, bolstered by low inflation and low interest rates.

Economic Lowlights:

  • ISM Manufacturing Index declines to 48.1. Any reading below 50 indicates contraction and is a potential recessionary signal.

  • Consumer Confidence Index softens from reaching all-time highs, leaving us to wonder whether the consumer will continue to buy goods and services at the same pace (which boosts GDP).

  • While leading indicators softened in the fall, the most recent reading leveled off. A negative trend here can signal a coming recession, but this softening hasn’t yet pushed us into the camp of calling for recession.

2019 was a strong year for U.S. markets. We predict positive returns will continue, just not at the same pace we experienced last year. At this point, we don’t expect a recession this year, but companies will likely face challenges as the Trade War continues. The 2020 election will continue to be on our minds as a party change in the White House could bring new economic policies.

As we welcome the New Year, we don’t want to miss the opportunity to express our gratitude for the trust you place in us each and every day. Thank you! Have a wonderful 2020!

On behalf of everyone here at The Center,

Angela Palacios, CFP®, AIF®
Partner & Director of Investments

Angela Palacios, CFP®, AIF®, is a partner and Director of Investments at Center for Financial Planning, Inc.® She chairs The Center Investment Committee and pens a quarterly Investment Commentary.


There is no guarantee that these statements, opinions or forecasts provided herein will prove to be correct. Past Performance does not guarantee future results.

One cannot invest directly in an index. The S&P 500 is an unmanaged index of 500 widely held stocks that is generally considered representative of the U.S. stock market. The MSCI EAFE (Europe, Australasia, and Far East) is a free float-adjusted market capitalization index that is designed to measure developed market equity performance, excluding the United States & Canada. The EAFE consists of the country indices of 22 developed nations. The Russell 2000 Index measures the performance of the 2,000 smallest companies in the Russell 3000 Index, which represent approximately 8% of the total market capitalization of the Russell 3000 Index. The Bloomberg Barclays US Aggregate Bond Index is a broad-based flagship benchmark that measures the investment grade, US dollar-denominated, fixed-rate taxable bond market.

The information has been obtained from sources considered to be reliable, but we do not guarantee that the foregoing material is accurate or complete.

Climate Change and What It Means for Investors

Jaclyn Jackson Contributed by: Jaclyn Jackson

Climate Change and What it Means for Investors

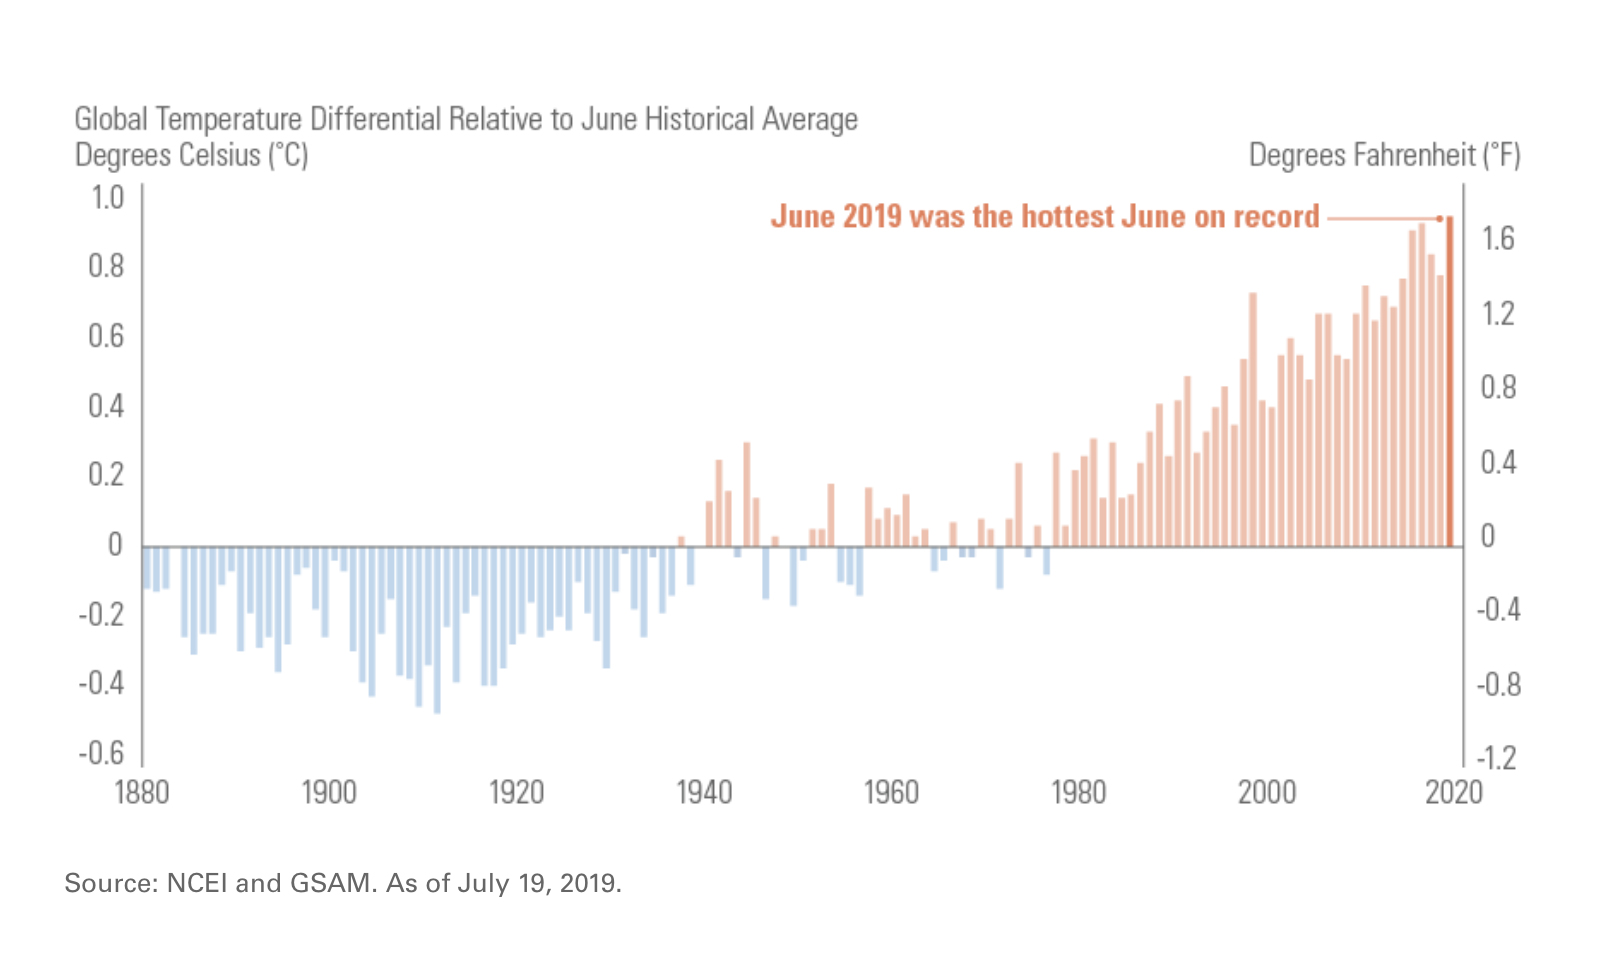
Coming in 1.71°F above its historical average of 59.9°F, June 2019 was the hottest June globally in 140 years of recorded data. June’s temperature increase is the latest in an upward trend that began in the 1970s. While debates hotter than any June persist about the validity of global warming, the fact remains that climate change carries significant implications for individuals, industries, and investors alike.

Global Temperature Differential Relative to June Historical Average

Industry and Economic Impact

Not convinced Mother Nature can wreak havoc on your day-to-day life? Just ask any New Yorker who recently experienced a heatwave, flooding, and power outages all in the same week. In fact, there’s no need to look that far; as of this writing, some Detroiters are still hoping to regain power after incredibly warm weather hit the region.

While it’s pretty clear how extreme weather conditions generate problems for energy companies, heatwaves can disrupt other industries. Manufacturing plants experience reduced production when temperatures soar above 90 degrees; fewer people look for homes, which affects the real estate industry’s most active season; and increased hospitalizations impact insurance companies. While these problems more directly speak to developed, urban areas and industries, they don’t even begin to define the potential implications of climate change around the globe.

Goldman Sachs summarized it best: “We believe that in addition to environmental impact, direct damage from mortality, labor productivity, agriculture, energy demand, and coastal storms may also significantly impact overall economic growth.”

Investors Demand More

It’s no wonder 477 global investors (including money managers and large pension funds around the world) issued a letter to governments attending the G-20 summit in Osaka, Japan. Commanding $34 trillion in assets, they’ve concluded that ignoring the Paris Agreement’s mission would create “an unacceptably high temperature increase that would cause substantial negative economic impacts.” Investors created the letter to petition government leaders to achieve the 2015 Paris Agreement goals, accelerate private sector investment into low carbon transition, and commit to improved climate-related financial reporting.

Be the Change

These investors also use their substantial financial weight to speak with companies in their portfolios about how they are addressing and alleviating industry-specific climate change issues. Individual investors can take a similar approach, by using their financial power to invest in mutual/exchange traded funds that evaluate the environmental, social, and governance (ESG) qualities of companies in their portfolios, as well as more traditional methods of research.

Are you ready to be the change?

Learn more about The Center’s Social Portfolio and ESG investing here.

Jaclyn Jackson is a Portfolio Administrator at Center for Financial Planning, Inc.® She manages client portfolios and performs investment research.


Investors should carefully consider the investment objectives, risks, charges and expenses of Mutual Funds and Exchange-Traded Funds (ETFs) before investing. The prospectus and summary prospectus contains this and other information about Mutual Funds and ETFs. The prospectus and summary prospectus is available from your financial advisor and should be read carefully before investing.

Opinions expressed are those of the author and are not necessarily those of Raymond James. All opinions are as of this date and are subject to change without notice. The information contained in this blog does not purport to be a complete description of the securities, markets, or developments referred to in this material. The information has been obtained from sources considered to be reliable, but we do not guarantee that the foregoing material is accurate or complete. Investing involves risk and investors may incur a profit or a loss regardless of strategy selected. Prior to making an investment decision, please consult with your financial advisor about your individual situation.

SOURCES: https://www.pionline.com/esg/investor-group-pleads-g-20-global-warming https://theinvestoragenda.org/wp-content/uploads/2019/06/FINAL-at-June-24-Global-Investor-Statement-to-Governments-on-Climate-Change-26.06.19-1.pdf

Investment Commentary: Second Quarter 2019

Center for Financial Planning, Inc.® Investment Commentary 2019

Mid-Year update

As summer feels like it is finally underway after a soggy start, the markets have had anything but a soggy start to the year. The first half of 2019 ended on a strong note, as the U.S. and China seemed to resume negotiations with a constructive air. This is the best first half of the year the S&P 500 has experienced since 1997, as it posted a 18.54% gain.

Interest rates

Bonds have also enjoyed strong results this year, with the Barclays US Aggregate Bond Index up 6.11%. The Federal Reserve left rates unchanged again in June, but has made a complete about-face over the first half of the year, from projecting multiple interest rate increases to a majority of officials now thinking rates will be lower by year-end.  This comes on the heels of steady interest rate increases since 2015. The dispute over trade policy between the U.S. and China and imposition of tariffs is the main stimulus behind this thinking. This change by the Federal Reserve of wanting to reduce rates rather than raise rates (also referred to as a more dovish stance) has given a strong boost to domestic bonds as well as emerging market debt. The market has already priced in two interest rate cuts by year-end and two more in 2020. While this aggressive rate cut schedule may not fully play out (just as the three rate increases forecast for 2019 at the end of 2018 did not happen), the Federal Reserve has clearly signaled a softening economy.

Economic Snapshot

If you look at the economy and set aside the risks from the trade war, you see a pretty strong current picture; however, some of the positive signs are getting less and less positive. The expansion we have been in for so long could continue a while longer, but it seems to have less wind in its sails than it did just a year ago.

Retail Sales have come in very strong for the first half of the year, on the heels of some of the strongest readings on consumer confidence since the mid-2000s.

The Unemployment Rate, 3.6%, is at the lowest level since December 1969. The labor market remains very tight, and wages are increasing at a pace higher than inflation. This supports the high consumer confidence number and consumer spending, which is such a large part of our economy.

Inflation remains subdued with both headline and core CPI coming in at 2% or less, despite the pickup in wage inflation. Tariffs could start to increase pressure here, but we haven’t seen this flow through to the data yet.

Housing prices have been on the decline over the past year; however, the Federal Reserve’s recent change in stance on interest rates could give another slight temporary boon to this market.

Risks that could increase market volatility

Another breakdown in U.S. China trade negotiations, which could cause an abrupt pullback in markets. The tariffs in place now would start to have longer-term impact on inputs for producing goods. Businesses impacted by the tariffs would have to either cut costs elsewhere – think layoffs and discontinuing of capital expenditures – or pass the price increase along to the end consumer. Either way, this alone could start to push the economy into recession. This wildcard could have far-reaching impacts on our economy and we are closely watching developments..

The Federal Reserve not following through on cutting interest rates, as the markets are currently anticipating. The futures markets have priced in nearly four rate increases over the next 18 months. If the Fed doesn’t cut rates, we may see market rates back on the rise, meaning a short-term potential slowdown in bond returns and some headwinds for emerging market debt.

An escalation in tensions between the U.S. and Iran, which has started to affect oil prices in a negative way, although prices are still lower than they were a year ago. A sharp increase in oil prices affects consumer confidence and spending, while also putting pressure on inflation to the upside. Oil rising very quickly to high levels is often an early signal of recession

Our investment committee meets monthly and informally talks every day, if needed, regarding developments in headline risks and the economy. Sometimes, these discussions result in action, and sometimes, we take a wait-and-see approach, with an eye toward certain indicators. Right now, we continue to monitor the inversion of the yield curve, as well as the weekly initial claims for unemployment insurance from the Federal Reserve Bank of St. Louis. Both data points can be leading economic indicators that may give us some early warning signs. While we think the year should finish in positive territory, we remain cautious with our outlook for 2020.

We continue to hear great feedback on our new Client portal! We have a new instructional video to help you learn how to navigate if you are already using the portal, but also to let you know what information you could see by signing up. If you are interested, please reach out to us so we can send you the link to activate it!

On behalf of everyone here at The Center, we hope you enjoy the rest of your summer!

Angela Palacios CFP®, AIF®
Partner
Director of Investments

Angela Palacios, CFP®, AIF®, is a partner and Director of Investments at Center for Financial Planning, Inc.® She chairs The Center Investment Committee and pens a quarterly Investment Commentary.


Any opinions are those of financial advisor and not necessarily those of Raymond James. The information has been obtained from sources considered to be reliable, but we do not guarantee that the foregoing material is accurate or complete. The S&P 500 is an unmanaged index of 500 widely held stocks that is generally considered representative of the U.S. stock market. The Bloomberg Barclays US Aggregate Bond Index is a broad-based flagship benchmark that measures the investment grade, US dollar-denominated, fixed-rate taxable bond market. Indices are not available for direct investment. Any investor who attempts to mimic the performance of an index would incur fees and expenses which would reduce returns. Certified Financial Planner Board of Standards Inc. (CFP Board) owns the certification marks CFP®, CERTIFIED FINANCIAL PLANNER™, CFP® (with plaque design), and CFP® (with flame design) in the U.S., which it authorizes use of by individuals who successfully complete CFP Board's initial and ongoing certification requirements.

The Gambler

sell buy hold stocks

While I’m not a big country music fan, one of the few country songs I can sing along to is “The Gambler” by Kenny Rogers. While Kenny certainly knew how to make money, he also had a pretty good idea of how to keep it: “You gotta know when to hold ‘em, know when to fold ‘em, know when to walk away, and know when to run.” There’s a valuable lesson for investors in those lyrics. 

Most investors (and professionals, too) spend a lot of time deciding which investments to buy and little time understanding when to sell. It’s crucial to have a security selection process in place, and to understand what you own and why you own it, even if it is just an index mimicking strategy.

Part of your process, even before buying a security, should be to outline reasons you would hold the investment even through downturn periods. This can help you resist the temptation to sell in the wrong moments, for the wrong reasons. It is also important to establish factors that could cause you to sell.

At The Center, some of our reasons to potentially change strategies within a portfolio are: 

Security specific

  • Key personnel departure

  • Attainment of your price target

  • Increased correlation to other investments

  • Deviation from intended outcomes

  • Expenses

Goal specific

  • Change in circumstances (ie. entering retirement)

  • Change in risk tolerance

  • Change in the outcome needed to achieve long-term financial planning goals

Having these points in mind will make thinking about selling a position or changing your overall investment strategy (strategic allocation) easier and much less emotional. 

While it is usually best to buy and hold over longer periods of time, knowing when to hold ‘em and fold ‘em doesn’t come easily. But with some thought, you can make prudent decisions when you buy and when you sell, because you never want to have to walk away … or worse yet … have to run!

Angela Palacios, CFP®, AIF®, is a partner and Director of Investments at Center for Financial Planning, Inc.® She chairs The Center Investment Committee and pens a quarterly Investment Commentary.


Any opinions are those of Angela Palacios and not necessarily those of Raymond James. This material is being provided for information purposes only and is not a complete description, nor is it a recommendation. Investing involves risk and you may incur a profit or a loss regardless of strategy selected. Prior to making an investment decision, please consult with your financial advisor about your individual situation.

Investment risk is real. Here’s how we manage it.

The Center Contributed by: Center Investment Department

Investment risk is real. Here's how we manage it.

Investment risk is real. Every day. Every year. In up and down markets. Even in good times – when, for example, U.S. Equities are performing well – we all can use this friendly reminder:

The management of investment risk is constant in successful investing.

Benjamin Graham, known as the “father of value investing,” dedicated much of his book, The Intelligent Investor, to risk. In one of his many timeless quotes, he states, “The essence of investment management is the management of risks, not the management of returns.” To many investors, this statement may seem counterintuitive. Rather than an alarm, though, risk may serve as a healthy dose of reality in all investment environments.

Our Take on Risk

How do we at The Center attempt to manage risk as we steward approximately $1.1 billion in assets? We:

We have been managing client assets for more than 34 years. We fully understand and appreciate the importance of investment returns. We also know that risk is an important element when constructing portfolios intended to fund some of life’s most important goals, such as sending a child or grandchild to college, funding a long and successful retirement, having sufficient funds for long-term health needs, and passing a legacy to loved ones.

While no one can guarantee future investment returns, our experience suggests that those who follow our risk management tactics may better stay on track with their financial plans. 

If you are a client, we welcome the opportunity to talk more about how your portfolio is constructed. Not a client? We’d enjoy the opportunity to share our experience and review your goals and risk.


Any opinions are those of Center for Financial Planning, Inc.® and not necessarily those of Raymond James. This material is being provided for information purposes only and is not a complete description, nor is it a recommendation. Investing involves risk and you may incur a profit or a loss regardless of strategy selected. Prior to making an investment decision, please consult with your financial advisor about your individual situation.