Center Investing

Mid-term Elections and the Market: 2018 Outcome

The Center Contributed by: Center Investment Department

Mid-term Election and the Market: 2018 Outcome

Voting day came and went much as the markets had anticipated.  Democrats flipped the House of Representatives over to their control while the Senate maintained and even strengthened their republican majority.  From a legislative policy perspective, we expect the republican agenda to slow.  Mid-term election implications may include:

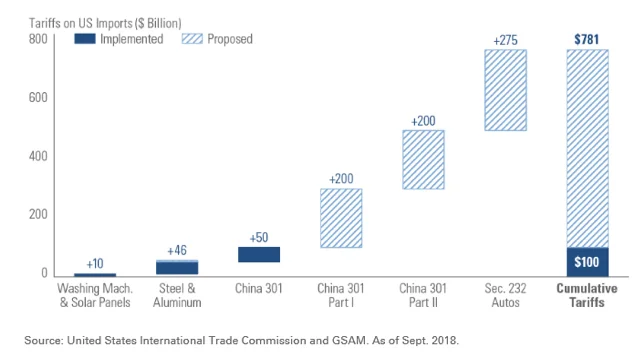
  • The President can continue to act alone regarding trade policies but had bi-partisan support for cracking down on China’s trade and intellectual property practices anyway

  • Democrats are going to scrutinize and investigate President Trump, his cabinet officials and executive actions…yes, even more!

  • Any further tax cuts are unlikely

  • Democrats will likely get to work on some infrastructure spending

  • Affordable Care act will be strongly defended

While markets care about legislation and the far-reaching impact those decisions make, long-term markets are agnostic to election results. Information and how markets digest the information affect investment outcomes more than politics.  Frankly, markets do not really care which side is in control.  In fact, the new balance of power sets a similar stage for the strongest historical performance in the S&P 500 for a republican president.  Want to learn more, check out this blog, “Mid-Term Elections and the Market.”


Any opinions are those of the author and not necessarily those of RJFS. The S&P 500 is an unmanaged index of 500 widely held stocks that is generally considered representative of the U.S. stock market. Investing involves risk and investors may incur a profit or a loss. Links are being provided for information purposes only. Raymond James is not affiliated with and does not endorse, authorize or sponsor any of the listed websites or their respective sponsors. Raymond James is not responsible for the content of any website or the collection or use of information regarding any website's users and/or members.

2018 Third Quarter Investment Commentary

20181016.jpg

Diversified portfolios continue their uphill battle as the U.S. Stock market continues to be one of the few sources of positive returns this year.  In August, the current bull market became the longest on record since World War II by avoiding a 20% drawdown during that time.  Recently, the equity markets fell sharply even though the near-term prospects for the economy remain strong, but there are concerns about the November election, trade policy disruptions, FED policy and labor market constraints. Increased volatility and see-sawing markets are likely to continue in the near term.

*annualized

*annualized

Bonds have continued to be under the pressure of gradually rising interest rates.  Since December 2016, the Fed has raised short-term rates by .25% during 8 of the last 15 meetings.  The last time we experienced rising interest rates was 2004-2006.  During this period, the Fed raised short-term rates by .25% in 17 consecutive meetings in contrast!  This time, they are taking a far more measured pace trying to increase borrowing costs for businesses and consumers to keep the economy from overheating.

International and especially emerging markets are struggling the most this year due to trade war concerns and a strong U.S. dollar even though they were the darlings of 2017.

Trade War Tracking

Since the trade war is at the top of the headlines each day, I thought it would be interesting to share a scorecard.  The below chart shows the tariffs that are still only in the proposal state (diagonal lines) and tariffs that have been put into place. You can see that only a small amount had been implemented before September. On September 21st, the next $200 Billion of tariffs were put into place (China 301 Part 1).  These are tariffs on an extensive list of goods and will start at a 10% tariff, escalating to a 25% tariff in January 2019.  China retaliated by placing tariffs on another $60 Billion in U.S. goods.  This list was smaller and the amount of tariffs placed on them was lower than the market anticipated which is why we didn’t see any negative reactions from the stock market during this round.

20181016b.jpg

While we are also actively negotiating trade policies with many countries, the focus and largest amount of potential tariffs are against Chinese imports.   According to the office of the U.S. Trade Representative “The United States will impose tariffs on…Chinese imports and take other actions in response to China’s policies that coerce American companies into transferring their technology and intellectual property to domestic Chinese Enterprises.  These policies bolster China’s stated intention of seizing economic leadership in advance technology as set forth in its industrial plans, such as ‘Made in China 2025.’”

While markets are more volatile this year seeming to be swayed by the latest tariff headline daily, local markets are still boasting 10.56%  returns on the S&P500 for the year through the end of September. This says to us that markets think this trade war is survivable and possibly even beneficial to the U.S.  While tariffs are generally a negative for an economy over the long-term, investors often, only see the short-term benefits these types of strong-arm policies can bring. 

The point of free trade is that each group of producers focus on what they are best at and can produce the most efficiently (also at the lowest price/best quality).They can then sell their products and use the money to purchase what they need from the most efficient producer.This process usually stretches your dollar the farthest when it comes to purchasing power.Tariffs place an additional tax on the consumer as they usually result in higher prices for us or reduced margins for companies (or a combination of the two).We don’t share the markets rosy outlook, as we believe this trade war will result, eventually, in inflation and supply chain disruptions.It takes time to ramp up production domestically of products that become too expensive to import.When companies face the uncertainty of what retaliatory actions are coming next, they are apprehensive to make the investments required to ramp up local production in the first place. 

Unemployment

We also have to consider that the unemployment rate is back to very low levels (blue line shows below 4% unemployment) and participations rates (gray bar) remain steady.  Where are we going to get all of the new workers required to start producing items locally rather than importing? 

20181016c.jpg

We don’t think this is how Trump foresees the end game.  He hopes to force China to remove the tariffs they have historically imposed on our goods to put us on a level playing field of no tariffs, no subsidies and preventing intellectual property drain.  Whether he is right and China will be forced to come to the negotiation table remains to be seen.  Volatility should continue at slightly higher levels if this trade war continues to ramp up.

Politics

Mid-term elections are coming up, and that always puts politics at the top of everyone’s minds.  There is also fear of impeachment that we often hear from clients and how that could affect portfolios.  Impeachment is the process where the House of Representatives through a simple majority brings charges against a government official.  After the government official is impeached, the process then moves to the Senate to try the accused.  This must pass the Senate by a 2/3’s majority vote.  If this happened, President Trump would be removed from the office, and the Vice President would take his place. 

There is little to refer to in recent history to understand how markets would react here in the U.S. if this were to happen.  Bill Clinton was impeached in 1998, and Richard Nixon resigned during the Impeachment proceedings but was never actually impeached.  There have been recent unsuccessful attempts to impeach Donald Trump, George W. Bush, and, yes, even Barack Obama.  When Bill Clinton was impeached markets were down in bear market territory (over 20% peak to trough on the S&P 500) for a short time before it rallied back.  The Russian Ruble Crisis also occurred at the same time, so it is hard to say that the impact to markets was solely due to the impeachment process. So while President Trump likes to boast that the “Markets will crash and that everyone will be poor” if he were impeached that is likely not the case. 

While we don’t think this has a high likelihood of happening, if it did, short-term volatility would probably occur while there is uncertainty and this is one of the many reasons why we maintain a diversified portfolio.  If stocks retreated, it is likely that our bond portfolios would perform well and even a possibility that international investments would strengthen in the face of a weaker dollar.  We believe a diversified portfolio with short-term needs set aside in cash or cash equivalents is one of the most effective solutions to an extremely rare event like this.

While this bull market may be getting old, it is important to remember they do not simply die of old age; rather they are killed by recessions.The yield curve is getting dangerously close to inverting but has not, thus not signaling a recession…yet.We are keeping a close eye on the yield curve and trade war as these items could quickly spill us over into a risk of recession. Markets can breeze along seemingly unconcerned by these types of risk until they aren’t.When sentiment swings from optimistic to pessimistic, it can happen almost overnight.As a result, we continue to maintain that having a diversified portfolio is extremely important.We are actively taking advantage of rebalancing opportunities to make sure your portfolios are prepared.If you have any questions or would like to speak with us more on these topics, please don’t hesitate to reach out to us!

Thank you for your continued trust!

On behalf of everyone here at The Center,

Angela Palacios, CFP®, AIF®
Director of Investments
Financial Advisor, RJFS

Angela Palacios, CFP®, AIF® is the Director of Investments at Center for Financial Planning, Inc.® Angela specializes in Investment and Macro economic research. She is a frequent contributor The Center blog.


The foregoing information has been obtained from sources considered to be reliable, but we do not guarantee that it is accurate or complete, it is not a statement of all available data necessary for making an investment decision, and it does not constitute a recommendation. Any opinions are those of Angela Palacios and not necessarily those of Raymond James. Investing involves risk and you may incur a profit or loss regardless of strategy selected, including diversification and asset allocation. The S&P 500 is an unmanaged index of 500 widely held stocks that is generally considered representative of the U.S. stock market. Indices are not available for direct investment. Any investor who attempts to mimic the performance of an index would incur fees and expenses which would reduce returns.

Implementing Your Asset Allocation

The Center Contributed by: Center Investment Department

20180911.jpg

At Center for Financial Planning, Inc.®, one of our core investment beliefs revolves around utilizing a strategic asset allocation. We believe there is an appropriate mix of assets that can help investors meet their goals based on well-established and enduring asset classes. This can vary over time depending on your objectives and evolving markets. Finding the right combination of these asset classes and allocation to each plays a pivotal role in managing risk and aiding in ensuring stabilizing returns. In previous blog posts, we’ve discussed the purpose of asset allocation and how to determine the proper asset allocation.  Now let us wrap up this subject with a hypothetical example of the implementation.

Below is a chart of a financial plan overhaul.  You can see there is quite a difference between the current allocation and a recommended allocation.  The current allocation (in blue) is overweight US Large Cap stocks and International Large Cap stocks while underweight the bond asset categories that we define as Core Fixed Income and Strategic Income.  The financial plan takes into consideration any outside accounts like 401k’s, insurance, and/or annuity products to truly understand an entire investment portfolio and determine a suitable asset mix. This helps keep a client within their volatility comfort range as well as on track to reach their return expectations over the long haul.

Source: Morningstar

Source: Morningstar

The recommendation involves selling some of the positions that fall within the overweight asset classes while adding to the underweight bond asset classes.  The end result should be a portfolio with less risk which can be important leading into those early years of retirement if returns had been excellent in recent years it would be important to have a careful eye toward taxes and work with a CPA to construct a tax efficient strategy to divest some of the risk. 

If you are unsure how your asset allocation stacks up, seek out a financial planner so they can assist you in developing an appropriate strategy tailored to your unique needs.


These asset allocations are presented only as examples and are not intended as investment advice. Actual investor results will vary. Prior to making an investment decision, please consult with your financial advisor about your individual situation. Although derived from information which we believe to be reliable, we cannot guarantee the completeness or accuracy of the information above. Any information is not a complete summary or statement of all available data necessary for making an investment decision and does not constitute a recommendation. Investments mentioned may not be suitable for all investors. Any opinions are those of Angela Palacios and not necessarily those of RJFS or Raymond James. Investing involves risk and asset allocation and diversification does not ensure a profit or protect against a loss. 1. Core Fixed Income includes: U.S. Government bonds and high quality corporates 2. Strategic Income includes: Non U.S. bonds, TIPS, high yield corporates and other bonds not in core fixed. 3. Strategic Equity includes: REITS, hedging strategies, commodities, managed futures etc. Large cap (sometimes "big cap") refers to a company with a market capitalization value of more than $10 billion. Large cap is a shortened version of the term "large market capitalization. Smaller mid caps, which are defined as those that fall below a certain market-cap breakpoint, and "small plus smaller mid caps", which include both companies considered small-cap and the smaller mid-cap companies. Mid caps are typically defined as companies with market caps that are between $2 billion and $10 billion. Mid-cap stocks tend to be riskier than large-cap stocks but less risky than small-cap stocks. Small caps are typically defined as companies with market caps that are less than $2 billion. Many small caps are young companies with significant growth potential. However, the risk of failure is greater with small-cap stocks than with large-cap and mid-cap stocks.

Is there a loss when a municipal bond purchased at a premium matures at par value?

The Center Contributed by: Center Investment Department

20180821.jpg

Investors often erroneously believe that they will lose money when purchasing a bond at a premium and allow it to mature at a lower par value.  In order to understand why this is not the case we should step back and explain some bond basics.

Coupon and Par Value explained

Bonds pay interest to you, the investor. A coupon is simply the amount of money that you receive at each interest payment (typically every six months). Par value, or the issuer’s price of a bond, is typically $1000. If a bond has a 5% coupon, then you receive 5% of $1000 every year; or $25 every 6 months.  The price you pay is often expressed as a percent of par value.  So if it is selling at $103 you are paying 103% of the par value, or $1,030. (1,000*1.03).

Why would you pay a premium?

When you buy a municipal bond at a premium price (or more than the $1,000 par value), you may be doing so because you are getting a higher coupon rate.  For example, let’s say the going market interest rate for a par value bond you are looking at is 3%.  If you found a bond that is paying a coupon of 4% with the same maturity you may think, “Jackpot!”  However, in order to buy this bond you are going to have to pay more than the $1,000 par value for the 3% bond. To better understand this we use the measure of yield to maturity (the rate at which the sum of all future cash flows from the bond is equal to the current price of the bond).  Ultimately, the yield to maturity should be very similar between the two bonds, you will just get more current income from the premium bond as it has a higher coupon, but you pay a higher price to get it.  Unfortunately, you don’t get to write off this “loss” when the bond matures and only pays you back the $1,000 par value.  The premium of this bond is amortized down each year and is being returned to you in the form of the higher coupon rate.  See the example below.

20180821a.jpg

Once the bond finally matures, you have amortized out all of the premium over the life of owning the bond and your cost basis would ultimately be the par value now.  Fortunately, you don’t have to worry about calculating this yourself.  IRS guidelines require your custodian to calculate and report this on your yearly 1099 Form.

The foregoing information has been obtained from sources considered to be reliable, but we do not guarantee that it is accurate or complete, it is not a statement of all available data necessary for making an investment decision, and it does not constitute a recommendation. Any opinions are those of Tim Wyman and not necessarily those of Raymond James. Bond prices and yields are subject to change based upon market conditions and availability. If bonds are sold prior to maturity, you may receive more or less than your initial investment. There is an inverse relationship between interest rate movements and fixed income prices. Generally, when interest rates rise, fixed income prices fall and when interest rates fall, fixed income prices rise. Investments mentioned may not be suitable for all investors. Investing involves risk and investors may incur a profit or a loss. Please include if clients are able to click on the link: Links are being provided for information purposes only. Raymond James is not affiliated with and does not endorse, authorize or sponsor any of the listed websites or their respective sponsors. Raymond James is not responsible for the content of any website or the collection or use of information regarding any website's users and/or members.

Sustainable Investments and Your Portfolio

Laurie Renchik Contributed by: Laurie Renchik, CFP®, MBA

Planning for a sustainable retirement is one that will financially support you for a lifetime. The financial planning process is dynamic as life unfolds and is subject to new information and changing circumstances along the way. 

One of the changes I see happening today is that a growing number of retirement savers are thinking more seriously about how a sustainable investment strategy fits into their overall investment plan. 

In tandem, the sustainable investment landscape is also evolving and growing.  Once a niche market, sustainable investing is becoming mainstream moving from a limited universe of investments focused on screening objectionable exposures to a range of solutions to achieve sustainable outcomes.  In fact, US investments focused on sustainable objectives grew 135% in the four year period from 2012 through 2016.**  With this volume of growth comes opportunity.  Demographic shifts, government policies and corporate views on environmental and social risk are the primary forces driving growth and change today.

For example, sustainable investing today includes Exclusionary Screens, ESG factors and Impact Targets.  Exclusionary screens avoid exposure to companies who operate in controversial sectors such as fossil fuels, tobacco or weapons.  ESG Factors invest in companies whose practices rank highly by Environmental, Social, and Governance (ESG) performance standards.  Impact Targets invest in companies whose products and solutions target measurable social or environmental impact.

If your goal is to create a sustainable retirement and in tandem allocate a portion of your investments to supporting a sustainable global future we can help. 

Our top priority is to create the best plan coupled with the best investment portfolio for you.  If that means taking sustainable investment preferences into consideration we have the resources and solutions available to build on traditional portfolio analytics to understand your current exposures and relevant sustainability factors.  We can set targets to improve the sustainability of your portfolio based on your personal objectives and measure performance data over time.

Contact us today to learn more!  Sustainable investing can drive positive social or environmental impact alongside financial results, allowing investors to accomplish more with their money.  Opportunity awaits.

Laurie Renchik, CFP®, MBA is a Partner and Senior Financial Planner at Center for Financial Planning, Inc.® In addition to working with women who are in the midst of a transition (career change, receiving an inheritance, losing a life partner, divorce or remarriage), Laurie works with clients who are planning for retirement. Laurie is a member of the Leadership Oakland Alumni Association and is a frequent contributor to Money Centered.


**Year over year growth in sustainable assets in the U.S. 2012 to 2016. Source: Global Sustainable Investment Alliance. Views expressed are not necessarily those of Raymond James Financial Services and are subject to change without notice. Information contained herein was received from sources believed to be reliable, but accuracy is not guaranteed. Information provided is general in nature, and is not a complete statement of all information necessary for making an investment decision. Past performance is not indicative of future results. There is no assurance these trends will continue or that forecasts mentioned will occur.  Investing always involves risk and you may incur a profit or loss. No investment strategy can guarantee success.

2018 2nd Quarter Investment Commentary

20180716.jpg

Helping our clients achieve their goals is truly a team effort here at The Center.  You may not have met or spoken to the investment team here at The Center, but we are an important resource leveraged to help you achieve your goals.  Watch the video below to learn more about the investment team and how we help you reach your financial planning destination!   We are always here to help so please don’t hesitate to reach out to us! 

Rebalancing

The investment team monitors and rebalances your portfolio, in addition to portfolio construction.  It is equally important to continue to monitor portfolios and their compliance with your investing preferences and objectives as it is to determine what the proper investments are.  Rebalancing is a key part of this process.  See our recent blog post on how to rebalance a portfolio to understand the reasons and mechanics behind the process.  The most important way to be successful is to get invested and stay invested.  Rebalancing your portfolio on occasion will help you stay the course for the long-term.

Market Update

The story has stayed much the same over the past quarter with trade tensions remaining center stage.  Volatility remains, while trade war talks have spilled over into action and interest rates continue to rise.  Synchronized global growth is slowing but is not yet slow; so, do not expect growth to immediately fall off the cliff from a peak to a trough. 

U.S. markets remain in consolidation mode after a strong 2017 as investors waffle between getting comfortable with the lower rate of growth while having a strong economic and earnings outlook.  The U.S. market ended the quarter on a higher note up 3.43% for the S&P 500 despite the ups and downs throughout the quarter with China and U.S. relations.  Despite being up as much as 6.6% and down as much as 4.4% throughout the year so far we are up 2.65% through the end of the second quarter for the S&P 500. 

Bond markets have continued to struggle with bonds giving back what they are earning via interest payments, and then some, as the Bloomberg Barclays US Aggregate bond index is down 1.6% year to date.  Interest rates continue to increase at a well-telegraphed pace by the Federal Reserve with two more increases expected this year. 

In contrast to the U.S. market, international markets are struggling for the year with the MSCI EAFE posting a -2.75% so far.  In stark contrast, domestic small company stocks are enjoying a nice tailwind from the corporate tax reform so far this year.  The Russell 2000 is posting a startling 7.6% return year-to-date, all of which occurred in the second quarter.

Inflation continues its slow creep back into our economy with wages slowly starting to increase.  Just as slowing growth in the economy is not yet slow, rising inflation is not high inflation.  We are still at very low levels of inflation when you look at the history of our domestic economy.  Our investment committee has decided to add an allocation to an inflation-focused real asset strategy.  We want to add exposure within the portfolios to a strategy that would have the potential to respond more favorably than the broad equity markets to rising inflation. 

Preview of exciting changes

The investment team has been working on some exciting developments for your experience.  We will soon have a “Center for Financial Planning, Inc®” app for your smartphone where you can view returns, asset allocation and even your probability of success for your financial plan.  This new portal will be available to all who are interested.  More information and training on how to set up and view information will be coming later this year so watch your inboxes!  As always, please feel free to reach out if you ever have any questions.

On behalf of everyone here at The Center,
Angela Palacios, CFP®, AIF®
Director of Investments
Financial Advisor 

Angela Palacios, CFP®, AIF® is the Director of Investments at Center for Financial Planning, Inc.® Angela specializes in Investment and Macro economic research. She is a frequent contributor The Center blog.


The information contained in this report does not purport to be a complete description of the securities, markets, or developments referred to in this material. The information has been obtained from sources considered to be reliable, but we do not guarantee that the foregoing material is accurate or complete. Any opinions are those of Angela Palacios and not necessarily those of Raymond James. Expressions of opinion are as of this date and are subject to change without notice. There is no guarantee that these statements, opinions or forecasts provided herein will prove to be correct. Investing involves risk and no strategy can ensure success. The process of rebalancing may carry tax consequences. Raymond James and its advisors do not offer tax or legal advice. You should discuss any tax or legal matters with the appropriate professional. Diversification and strategic asset allocation do not ensure a profit or protect against a loss. The S&P 500 is an unmanaged index of 500 widely held stocks. The Bloomberg Barclays US Aggregate Bond Index is a market capitalization-weighted index, meaning the securities in the index are weighted according to the market size of each bond type. Most U.S. traded investment grade bonds are represented. Municipal bonds, and Treasury Inflation-Protected Securities are excluded, due to tax treatment issues. The index includes Treasury securities, Government agency bonds, Mortgage-backed bonds, Corporate bonds, and a small amount of foreign bonds traded in U.S. The MSCI EAFE (Europe, Australia, Far East) index is an unmanaged index that is generally considered representative of the international stock market. These international securities involve additional risks such as currency fluctuations, differing financial accounting standards, and possible political and economic instability. The Russell 2000 index is an unmanaged index of small cap securities which generally involve greater risks. Inclusion of these indexes is for illustrative purposes only. Keep in mind that individuals cannot invest directly in any index, and index performance does not include transaction costs or other fees, which will affect actual investment performance. Individual investor's results will vary. Past performance does not guarantee future results. Bond prices and yields are subject to change based upon market conditions and availability. If bonds are sold prior to maturity, you may receive more or less than your initial investment. Holding bonds to term allows redemption at par value. There is an inverse relationship between interest rate movements and bond prices. Generally, when interest rates rise, bond prices fall and when interest rates fall, bond prices generally rise.

Under the Hood: Investment Allocation for 529 Savings Plans

Contributed by: Matthew E. Chope, CFP® Matt Chope

20180710.jpg

As many parents and grandparents know, 529 plans can be a wonderful strategy for families to help build college tuition savings for their children.  Not only do the plans benefit students, but they also carry advantages for the account creators or donors. The student can potentially enjoy tax-deferred growth with federally tax-free distributions if used for qualified educational expenses. Advantages to the donor include complete control of the account, high contribution limits, and no age restrictions or income limitations to inhibit investing.  It’s no surprise that 529 savings plans have become popular savings vehicles.

Have you ever wondered how 529 college savings plans are invested to meet time-sensitive tuition expenses? 

Age-based investment funds make this challenge easily manageable.  The graph below shows the glide path of equity allocations for 529 savings plans at various ages of the beneficiary from 2010 to 2013.

20180710a.jpg
  • Generally, 80% of the portfolio is invested in equities at age 0 and reduces to 10% by the time the beneficiary is enrolled in college.

  • Since 2010, plan investment managers have become more conservative in the beginning (age 0) and end (age 19) stages of plans.

  • Investment managers have become 6-7% more equity aggressive during ages 5-15 to meet tuition goals.

To meet tuition needs within 18 years, the graph reveals that investment managers are becoming more aggressive during the middle of a student’s investment time horizon, but they are also growing more cautious about preserving money closer to the end of the student’s investment time frame.  Interestingly, the graph also reveals that investment managers still rely on bonds as one of the safest places to preserve money (90% of the portfolio by age 19), despite the negative reputation bonds have received in our current rising rate environment. 

The glide path is designed to allow for an outcome with minimal surprises to all investors, no matter the economic environment when it’s time for college.  Some cycles will end on a poor note with markets crashing, while in other times markets will be soaring as students begin to tap the funds.  Ultimately, the guide path is designed to gradually reduce investors’ risk and exposure to market disruptions in the final years of saving, when investors are closest to needing the money they’ve worked so hard to save.  

Investors should carefully consider the investment objectives, risks, charges and expenses associated with 529 plans before investing. This and other information about 529 plans is available in the issuer's official statement and should be read carefully before investing. Investors should consult a tax advisor about any state tax consequences of an investment in a 529 plan.

As with other investments, there are generally fees and expenses associated with participation in a 529 plan. There is also a risk that these plans may lose money or not perform well enough to cover college costs as anticipated. Most states offer their own 529 programs, which may provide advantages and benefits exclusively for their residents. The tax implications can vary significantly from state to state.

Matthew E. Chope, CFP ® is a Partner and Financial Planner at Center for Financial Planning, Inc.® Matt has been quoted in various investment professional newspapers and magazines. He is active in the community and his profession and helps local corporations and nonprofits in the areas of strategic planning and money and business management decisions.


The foregoing information has been obtained from sources considered to be reliable, but we do not guarantee that it is accurate or complete, it is not a statement of all available data necessary for making an investment decision, and it does not constitute a recommendation. Any opinions are those of the author and are not necessarily those of Raymond James.

2018 1st Quarter Investment Commentary

20180412.jpg

Trade wars and tariffs have dominated the headlines over the past quarter. Volatility has increased for equity markets around the world because there are fears stemming from the possibility of a trade war.  To learn more about tariffs and what we think about how this could impact the markets click here.

The Federal Reserve (FED) raised rates as anticipated in March.  This is the first rate hike of the year.  There are two more rate hikes widely expected to come this year.  Gross Domestic Product (GDP) growth has been slightly ahead of what has been expected; so, this could hint at a faster rate hike path than anticipated.  Economists were expecting growth to come in at 2.7% for the 4th quarter and it came in at a revised 2.9%.  Good news for the economy as we are growing faster and seem to be on solid footing.  However, if the market thinks that the FED will start to raise rates faster in response to increased growth, this could negatively impact bond prices as their yields increase.  Both consumer spending and business investment have been strong.  Payroll taxes went down in February with the new tax reform which means we may have more money in our pockets, meaning we have the capacity, now, to spend even more.

The story is even better overseas as GDP growth has gone from mixed throughout the world (disappointing in most countries outside of the U.S. up until recently) to synchronized expansion.

Breaking a streak

The Dow Jones Industrials Average and the S&P 500 snapped an impressive nine-quarter streak of gains.  This has been the longest stretch of quarterly gains for the Dow for over two decades.  Prior long streaks were broken in 1997 (an 11 quarter rally for the Dow).  The S&P had a more recent impressive streak that also lasted nine quarters and was broken the first quarter of 2015.  Other markets including bonds and international were also down this quarter.  See the chart below for more details

20180412_chart.jpg

The cash quandary

Have you noticed your money market or bank deposits rates spiking along with all of these rate hikes from the Federal Reserve?  If not, you aren’t alone.  Rates have continued to remain frustratingly low on our most liquid savings accounts.  While the FED has raised rates by .25% on six separate occasions since 2015, deposit rates have not moved much.  There are two likely reasons for this:

  1. While the FED has raised short-term rates, long-term rates have not reacted as much. Since banks make money on the difference between the interest they charge on loans (which tend to be longer, think mortgages) and what they pay out in interest to their depositors, rates have stayed low for depositors. Banks have been unable to increase the rates they charge to loan individuals money and, therefore, they cannot raise the rates they pay on savings accounts.

  2. Deposits at banks in small savings accounts are at an all-time high. This money tends to be steady even if the interest rate paid at the bank down the street is higher. So banks don’t have to raise the rates they pay to keep the assets. It is too much of a bother to close your account, withdraw the money, open a new account and deposit the money for a .1% boost in the interest rate.

Technology volatility

Technology stocks are catching headlines recently as Facebook had a breach of privacy and Apple and Alphabet suffer from fears of tightening regulation.  The recent darlings of the stock market suffer because investors are calling in to question all of these technology companies that gather our personal data to enhance our user experience.

Midterm Elections

While it is still early in the year, midterm elections are starting to heat up.  Democrats are out of power, and the midterm elections tend to favor the party that is out of power.  Currently, we have a strong economy, and that is a factor that can influence whether voters go out to the polls and for whom they vote. A stable economy tends to encourage the status quo vote. The increased stock market volatility could favor the party that is out of power, though.  While I’m not here to debate who will and won’t win, I am interested in how(or if) that could affect your portfolios.  Generally, it isn’t a good idea to make changes within a portfolio based on politics.  Politics are emotional, and it is rarely a good idea to mix these sensitive emotions with our investment dollars.  We generally recommend not to make any major changes to a portfolio driven solely by an upcoming election. 

In times of market distress including the areas outlined above that cause temporary volatility in markets, investors need to focus on the basics:

  • sticking to a diversified portfolio

  • maintaining appropriate cash reserves

  • rebalancing

If you ever have any questions on these or other topics don’t hesitate to reach out to us!

On behalf of everyone here at The Center,

Angela Palacios, CFP®, AIF®
Director of Investments
Financial Advisor

Angela Palacios, CFP®, AIF® is the Director of Investments at Center for Financial Planning, Inc.® Angela specializes in Investment and Macro economic research. She is a frequent contributor The Center blog.


https://finance.yahoo.com/news/dow-streak-quarterly-gains-risk-184351660.html https://am.jpmorgan.com/us/en/asset-management/gim/protected/adv/insights/should-i-hold-cash The information contained in this commentary does not purport to be a complete description of the securities, markets, or developments referred to in this material. The information has been obtained from sources considered to be reliable, but we do not guarantee that the foregoing material is accurate or complete. Any opinions are those of the professionals at The Center and not necessarily those of Raymond James. Expressions of opinion are as of this date and are subject to change without notice. There is no guarantee that these statements, opinions or forecasts provided herein will prove to be correct. This material is being provided for information purposes only. Any information is not a complete summary or statement of all available data necessary for making an investment decision and does not constitute a recommendation. Please note, changes in tax laws may occur at any time and could have a substantial impact upon each person's situation. While we are familiar with the tax provisions of the issues presented herein, as Financial Advisors of RJFS, we are not qualified to render advice on tax or legal matters. You should discuss tax or legal matters with the appropriate professional. Investments mentioned may not be suitable for all investors. Future investment performance cannot be guaranteed, investment yields will fluctuate with market conditions. Investing involves risk and you may incur a profit or loss regardless of strategy selected. The S&P 500 is an unmanaged index of 500 widely held stocks that is generally considered representative of the U.S. stock market. Keep in mind that individuals cannot invest directly in any index, and index performance does not include transaction costs or other fees, which will affect actual investment performance. Individual investor's results will vary. Past performance does not guarantee future results. Prior to making an investment decision, please consult with your financial advisor about your individual situation. The companies engaged in the communications and technology industries are subject to fierce competition and their products and services may be subject to rapid obsolescence. The MSCI EAFE (Europe, Australasia, and Far East) is a free float-adjusted market capitalization index that is designed to measure developed market equity performance, excluding the United States & Canada. The EAFE consists of the country indices of 22 developed nations. The Dow Jones Industrial Average (DJIA), commonly known as “The Dow” is an index representing 30 stock of companies maintained and reviewed by the editors of the Wall Street Journal. The Russell 2000 Index measures the performance of the 2,000 smallest companies in the Russell 3000 Index, which represent approximately 8% of the total market capitalization of the Russell 3000 Index. The Barclays US Aggregate Bond Index is a broad-based flagship benchmark that measures the investment grade, US dollar-denominated, fixed-rate taxable bond market. The Bloomberg Barclays U.S. Corporate High Yield Bond Index is composed of fixed-rate, publicly issued, non-investment grade debt, is unmanaged, with dividends reinvested, and is not available for purchase. The index includes both corporate and non-corporate sectors. The corporate sectors are Industrial, Utility and Finance, which include both U.S. and non-U.S. corporations. The IA SBBI US IT Government Bond Index is an index created by Ibbotson Associates designed to track the total return of intermediate maturity US Treasury debt securities. Links are being provided for information purposes only. Raymond James is not affiliated with and does not endorse, authorize or sponsor any of the listed websites or their respective sponsors. Raymond James is not responsible for the content of any website or the collection or use of information regarding any website's users and/or members.


4th Quarter Investment Commentary

If you're interested in attending our Annual Client Investment Review Event at the Great Lakes Culinary Center on February 20th at 11:30am, please register here. If you can't attend, consider our Investment Review Webinar on Tuesday, February 20th at 1PM, please register here.

2017 in Review and Outlook for 2018

Fidget spinners, bitcoins, and Trump.  If you have young children, you could not miss the fidget spinner craze that hit in April of this year.  This simple toy rotates on a ball bearing.  By the time I got around to getting my 10-year-old child one in mid-May for her birthday, they were SO yesterday.  My major parenting fail of 2017!  In the financial world, another mania took over.  Bitcoin, while not brand new, certainly gained a ton of traction this year as an alternative cryptocurrency.  The price of Bitcoin surged from below $1,000 per bitcoin to more than $19,000!  This paved the way for many other cryptocurrencies (Bitcoin competitors) making their way to center stage with astonishing returns also.  If you want more information, check out this blog Talking Bitcoin, written by Nick Boguth earlier this year. 

20180116b.jpg

The news cycle has also revolved around President Trump this year.  While failing to overhaul Obamacare or U.S. trade policy, he was successful in getting some long-anticipated tax reform through to round out his first full year as our President.

The past year turned out to be far more bullish than many expected.  International and emerging markets outpaced U.S. markets.  Growth investing beat value investing, while Bonds returned little more than their yield.  2018 has a tough act to follow!

20180116a.jpg

Tax Reform and its Impact on the Economy

Although the tax cut seems to favor corporations, much of the net tax cuts are going to the individual.  The tax act should increase after-tax income for most American households both directly, through lower personal taxes, and indirectly, through the impact of higher dividends and stock prices resulting from the cut in corporate taxation.  As people spend more, GDP should increase and unemployment should continue to decrease possibly causing the wage inflation we have been waiting for.  This chart shows the level of unemployment (gray line) and the level of wage inflation the (blue line). The dotted lines for each color are average levels.  You can see that both are below their average levels.  Usually when unemployment is below average the wage growth line rises back to its long-term average level, but this has not happened yet.  Retiring higher-paid baby boomers are being replaced with lower-paid millennials entering the workforce and this has had a significant downward pressure on wages keeping it well below its long-term average growth rate. 

If wages finally start to increase, this could cause inflation to pick up somewhat. This would be a positive influence on the stock market in the short run.

20180116c.jpg

Tax Reform and its Impact on Equities

Looking at the influence tax reform will have on corporations, smaller companies will likely see a more impactful tax benefit with the corporate tax rate cut to 21% (which consequently is just below the average of the countries in the OECD or the organization for economic co-operation and development).  Currently, small cap companies pay the highest tax rates.

4thQ5.png

After a strong year for equities, the impact of tax reform could be more muted than you might think as the markets already anticipated some corporate tax reform passing. Quite often, equity prices factor these events in long before the pen hits the paper.

Tax Reform and its Impact on Fixed Income

Bond markets will have mixed implications from tax reform.  Companies that over-levered and don’t have strong positive cash flow will be penalized.  This new law places limits on the interest that corporations can deduct.  This will likely affect companies who are issuers of high yield debt negatively.  While companies investing for growth by making capital expenditures will be rewarded as, they are now allowed to expense a larger amount of these capital expenditures.

Municipal bonds should fare well next year with limits being placed on state tax and property tax deductions, especially in states with higher tax rates.  Other opposing forces could affect supply within the municipal bond market in the coming year from tax reform.  The law eliminates the issuance of advance refunding bonds that are used to retire old debt.  These bonds help boost supply by 10-20% each year in the municipal bond market.  On the flip side, corporations will be less incentivized to hold onto municipal debt as their tax rates have been slashed. If they sell these bonds into the market place that could increase supply, which could lower bond prices.  However, these two forces may cancel each other out.  It looks like the elimination of advance refunding bonds will likely offset any boost in supply from corporations selling.

Interest rates on the rise

The Fed raised short-term interest rates again in December, which was highly anticipated.  They are planning to continue with three more rate hikes in 2018. The bond market already anticipates these rate hikes, which means they should be priced in.  Jerome Powell is set to take over for Janet Yellen in February as the new Federal Reserve Chairperson.  It is unlikely he will change the trajectory of increases expected in 2018. 

The rate hikes have resulted in a flattening of the yield curve this year.  The charts show side-by-side where the yield curve started 2017 and where it is finishing 2017.  If you recall, an inversion of the yield curve, downward instead of upward sloping from left to right, or short-term rates higher than long-term rates, usually signals an oncoming recession.  While we aren’t there yet, this can happen quickly, so it is something we are keeping a close eye on.

4thQ6.png
Source: http://stockcharts.com/freecharts/yieldcurve.php

Source: http://stockcharts.com/freecharts/yieldcurve.php

Low volatility

The exciting part of 2017 was the lack of excitement.  2017 saw incredibly low average daily moves in the S&P500.  You can see from the below chart that standard deviation, or the variation of price movement by percent, for the S&P 500 is well below the typical range.  It is currently below 6%, which has only occurred five times since 1940.  Typically, it is between 10% and 18% each year.

Source: https://www.mutualfundobserver.com/2017/09/historically-low-volatility/

Source: https://www.mutualfundobserver.com/2017/09/historically-low-volatility/

During times like this, it is easy to get lulled into a false sense of security causing you to potentially reach for a little more risk to spice up your returns.  But, it is important to remember that your risk tolerance isn’t nearly as stable as you think it is.  Outside of our natural behavioral tendencies to want to chase great returns or hide from stocks after a sharp drawdown, our natural progression through life’s milestones can influence our tolerance for risk.  Milestones like a house sale, job change, or death of a loved one can influence our desire to take on risk just like the market performance and volatility.  This makes it hard to compare yourself and your portfolio’s returns to a static benchmark over the years.  Before making any drastic changes to your investment strategy, it is important to discuss with your financial planner the importance of a diversified portfolio that fits with your unique long-term goals and tolerance for risk. 

As we welcome the New Year, we don’t want to miss the opportunity to express our gratitude of the trust you place in us each and every day.  Thank you!

On behalf of everyone here at The Center,

Angela Palacios, CFP®, AIF®
Director of Investments
Financial Advisor

Angela Palacios, CFP®, AIF® is the Director of Investments at Center for Financial Planning, Inc.® Angela specializes in Investment and Macro economic research. She is a frequent contributor The Center blog.


The information contained in this commentary does not purport to be a complete description of the securities, markets, or developments referred to in this material. The information has been obtained from sources considered to be reliable, but we do not guarantee that the foregoing material is accurate or complete. Any opinions are those of the professionals at The Center and not necessarily those of Raymond James. Expressions of opinion are as of this date and are subject to change without notice. There is no guarantee that these statements, opinions or forecasts provided herein will prove to be correct. This material is being provided for information purposes only. Any information is not a complete summary or statement of all available data necessary for making an investment decision and does not constitute a recommendation. Please note, changes in tax laws may occur at any time and could have a substantial impact upon each person's situation. While we are familiar with the tax provisions of the issues presented herein, as Financial Advisors of RJFS, we are not qualified to render advice on tax or legal matters. You should discuss tax or legal matters with the appropriate professional. Investments mentioned may not be suitable for all investors. Future investment performance cannot be guaranteed, investment yields will fluctuate with market conditions. Investing involves risk and you may incur a profit or loss regardless of strategy selected. The S&P 500 is an unmanaged index of 500 widely held stocks that is generally considered representative of the U.S. stock market. Keep in mind that individuals cannot invest directly in any index, and index performance does not include transaction costs or other fees, which will affect actual investment performance. Individual investor's results will vary. Past performance does not guarantee future results. Prior to making an investment decision, please consult with your financial advisor about your individual situation. The prominent underlying risk of using bitcoin as a medium of exchange is that it is not authorized or regulated by any central bank. Bitcoin issuers are not registered with the SEC, and the bitcoin marketplace is currently unregulated. Bitcoin and other cryptocurrencies are a very speculative investment and involves a high degree of risk. Investors must have the financial ability, sophistication/experience and willingness to bear the risks of an investment, and a potential total loss of their investment. Securities that have been classified as Bitcoin-related cannot be purchased or deposited in Raymond James client accounts.


Investment Commentary: 3Q 2017

20171013.jpg

This summer came and went with no shortage of topics for investors to worry about.  Low inflation, natural disasters, and geopolitical tension kept the headlines busy.  Despite all of this, the quarter ended on a positive note.  The uptick in markets was spurred on by a wide-spread pick up in global growth.  Recession risks continue to remain muted as dovish global central banks continue to inject liquidity in the system, or only very slowly begin to pull back on the injections.  In general, economic data remains strong.   We remain watchful for a slowing, particularly in manufacturing, business and consumer confidence, as these are early indicators of the tide of the economy turning. However, they are still positive.

Diversification is coming back into style as international and emerging markets continue to perform stronger than their domestic counterparts this year.  The S&P 500 Index ended the quarter returning 14.24% through the 30th of September.  International markets are truly the bright spot with the MSCI EAFE returning 19.96% and the MSCI EM Index returning 27.78%.  Bonds ended the third quarter with a respectful 3.14% return coming from the Barclays US Aggregate Bond Index.

Rates remain unchanged

In September, the Federal Reserve (Fed) kept rates unchanged, but also announced additional information on how it will begin to unwind the $4.5 trillion balance sheet in October. 

The Committee intends to gradually reduce the Federal Reserve's holdings of treasury securities and agency securities--agency debt and agency mortgage-backed securities (MBS)--by decreasing the reinvestment of the principal payments it receives from securities holdings. Each month, such payments will be reinvested only to the extent that they exceed a pre-specified cap. The caps will rise gradually at three-month intervals over a 12-month period and the maximum value of the caps at the end of the 12-month period will be maintained until the size of the balance sheet is normalized. (https://www.federalreserve.gov/monetarypolicy/policy-normalization-qa.htm)

This plan to shrink the balance sheet seems to reflect the Fed’s positive view of the U.S. economy.

blog3.png

Proposed tax changes being debated

Political stakes are high for President Trump to score a legislative win on what remains of his campaign promises.  In late September, he unveiled a proposal to slash taxes for individuals and businesses.  To simplify the tax code, Republicans have proposed condensing from seven tax brackets down to three (12%, 25% and 35%), doubling the standard deduction to help tax payers eliminate the need to itemize, and “significantly increasing” the child tax credit while also adding a new tax credit for the care of non-child dependents (elder-care situations).

Currently, many taxpayers use itemized deductions, claiming write-offs for things like charitable contributions, interest paid on a mortgage, state and local taxes. If the standard deduction becomes larger, fewer taxpayers will need to itemize, reducing the incentive to hold a mortgage or contribute to charity.

President Trump is also proposing to cut the corporate tax rate from 35% down to 20%.  A new tax rate would be established for pass-through entities which represent about 95% of businesses in the United States.  Generally when corporate tax rates are cut, markets perform very well in the year following the tax cut. The chart below demonstrates that after the rate cut for corporate taxes (Orange area below the line), the following 1 year returns on the S&P500 are quite positive (blue bar above the line).

Michigan 529 plan changes

In September, the Michigan 529 Advisor Plan, transitioned its program from Allianz Global Investors to Nuveen Securities, LLC.  Account numbers stayed the same and investments mapped over to similar strategies; if you had one of these accounts, the transition was seamless.  Some of the benefits of the change include an expanded investment line-up, more leading edge investment managers and lower fees.  If you have any questions don’t hesitate to reach out!

After several years of equity volatility near historic lows, this quarter we again experienced the speed and scale at which geopolitics can possibly move markets. We remain committed to the view that managing volatility is at the heart of proper portfolio design.  It is a responsibility we take very seriously and we thank you for the continued trust you place in us to help you with these decisions!

On behalf of everyone here at The Center,

Angela Palacios, CFP®, AIF®
Director of Investments
Financial Advisor

invcom_pulse_400x200-2.jpg

Investment Pulse: Check out Investment Pulse, by Nick Boguth, a summary of investment-focused meetings for the quarter.

invcom_phd_400x200.jpg
invcom_basics_400x200.jpg

Investor Basics Series: Nick Boguth, Investment Research Associate, talks about exchange rates.

invcom_ofnote_400x200.jpg

Of Financial Note:  Jaclyn Jackson, Portfolio Coordinator, shares a look at the asset flow for 3rd quarter.

Angela Palacios, CFP®, AIF® is the Director of Investments at Center for Financial Planning, Inc.® Angela specializes in Investment and Macro economic research. She is a frequent contributor The Center blog.


This information does not purport to be a complete description of the securities, markets, or developments referred to in this material; it has been obtained from sources considered to be reliable, but we do not guarantee that it is accurate or complete. Any opinions are those of Angela Palacios and are not necessarily those of Raymond James. This information is not a complete summary or statement of all available data necessary for making and investment decision and does not constitute a recommendation. Investing involves risk; investors may incur a profit or loss regardless of the strategy or strategies employed. International investing involves special risks, including currency fluctuations, differing financial accounting standards, and possible political and economic volatility. Investing in emerging markets can be riskier than investing in well-established foreign markets. Asset allocation and diversification do not ensure a profit or guarantee against loss. Past performance is not a guarantee of future results. The MSCI EAFE (Europe, Australasia, and Far East) is a free float-adjusted market capitalization index that is designed to measure developed market equity performance, excluding the United States & Canada. The EAFE consists of the country indices of 21 developed nations. The MSCI Emerging Markets is designed to measure equity market performance in 25 emerging market indices. The index's three largest industries are materials, energy, and banks. The S&P 500 is an unmanaged index of 500 widely held stocks that is generally considered representative of the U.S. stock market. The Barclays Capital US Aggregate Index is an unmanaged market value weighted performance benchmark for investment-grade fixed rate debt issues, including government, corporate, asset backed, mortgage backed securities with a maturity of at least 1 year. Please note direct investment in any index is not possible. Index performance does not include transaction costs or other fees, which will affect actual investment performance. Individual investor's results will vary.